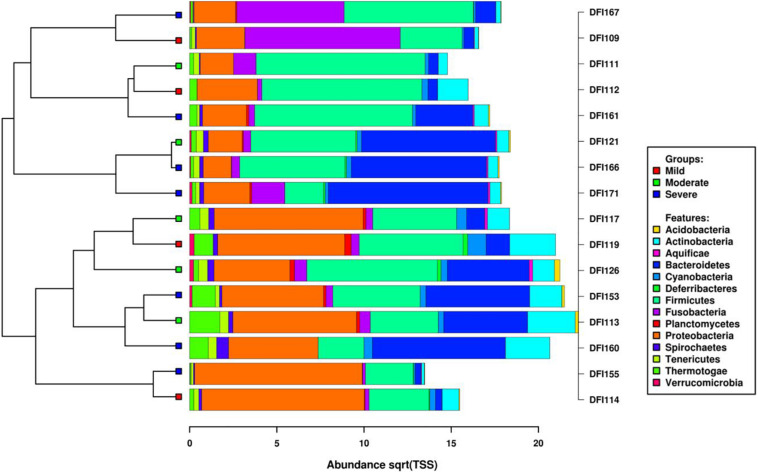
FIGURE 2.
Clustered bar chart based on hierarchical clustering of the Bray–Curtis distances of the DFIs based on the taxonomic composition of active bacterial phyla as determined by metatranscriptome sequencing predicted using Kraken and visualized in Calypso. The horizontal axis is the square root abundances of the identified taxa.

