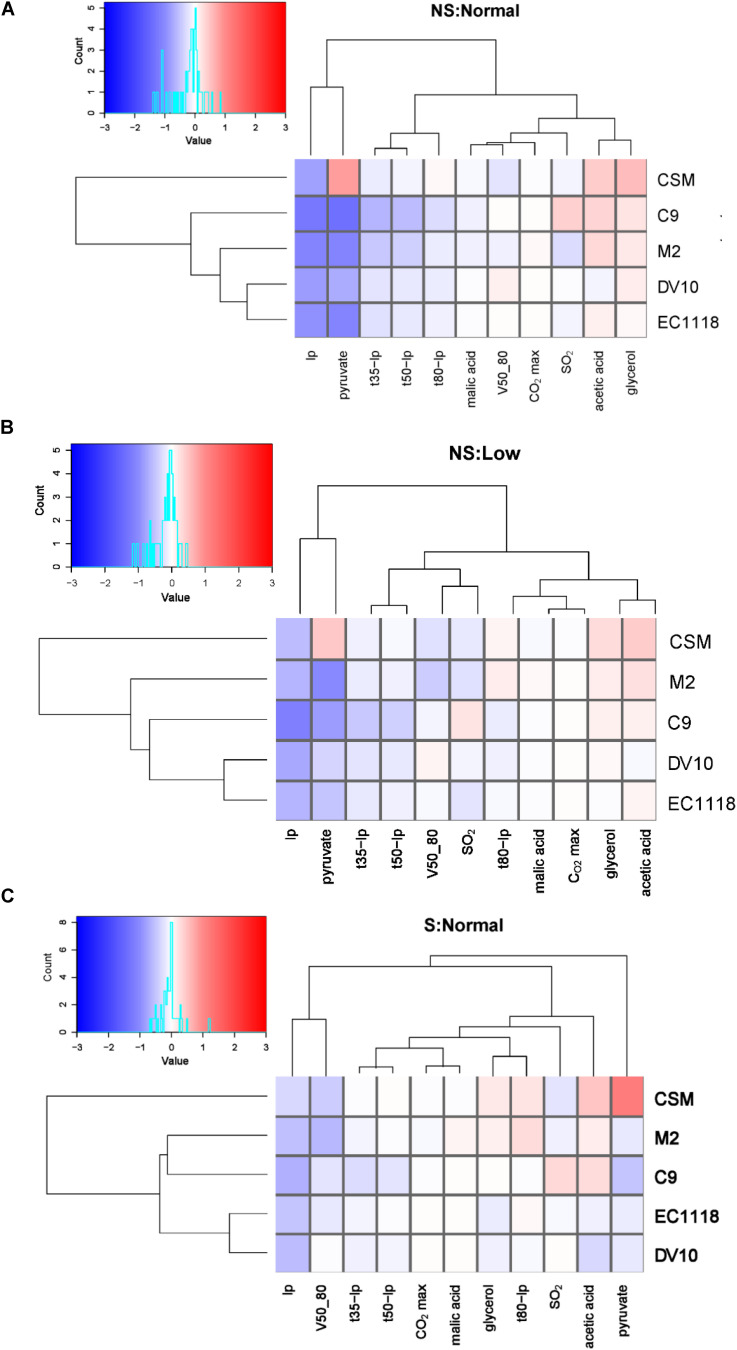
FIGURE 2.
The haploid wine strain shows a similar behavior to commercial strains. Heatmaps showing relative changes in the kinetics and end-product concentrations of the selected wine strains (C9, CSM, EC1118, DV10, and M2) relative to the laboratory strain for three conditions. (A) No shaking: normal nitrogen; (B) No shaking: low nitrogen; (C) Shaking: normal nitrogen. Log 2 of the normalized data is shown, with color indicating a higher (red) or lower (blue) value than the reference strain. The clustering of parameters and strains shows Euclidean distance.

