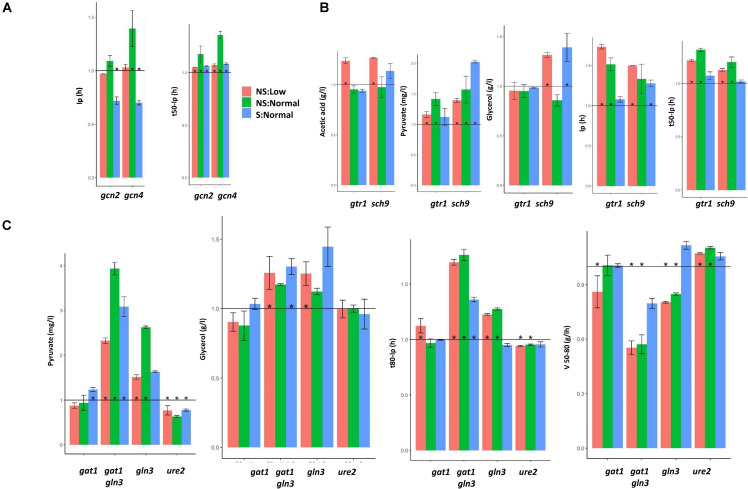
FIGURE 8.
The mutations on the different nutrient signaling pathways have their own phenotypic signature. (A) Parameters of interest in the mutations in genes GAAC, GCN2, and GCN4. (B) The same for the components of TOR pathway GTR1 and SCH9. (C) Similar analysis for NCR components GLN3, GAT1, and URE2. Fermentations were carried out in triplicate, and average and standard deviations are shown. Significant differences (p < 0.05) are marked by *.

