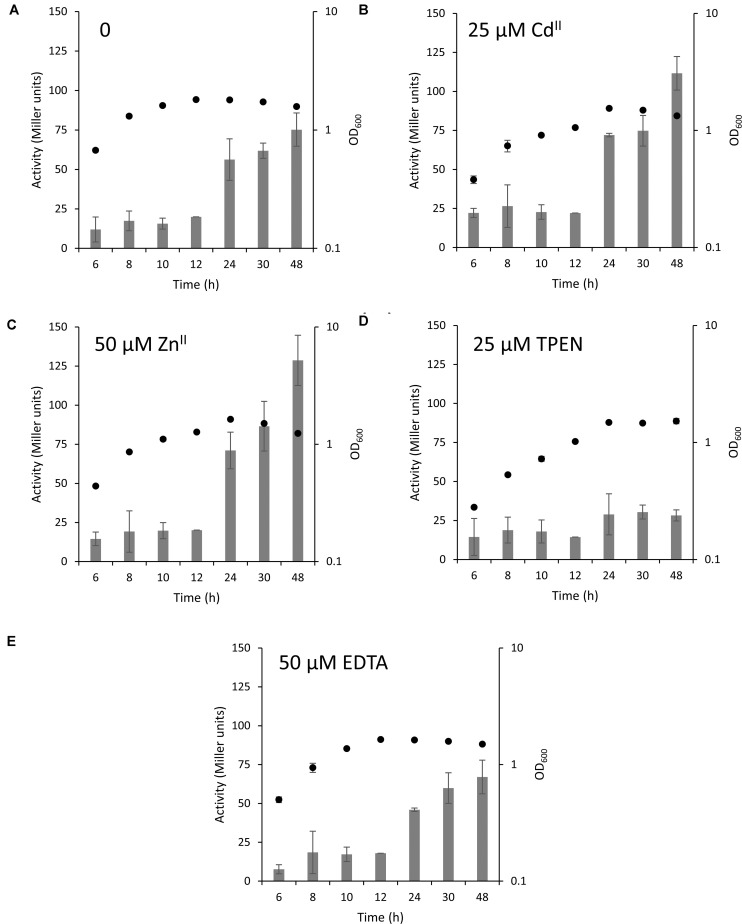
FIGURE 4.
MT expression in different stages of bacterial growth. MT expression in the wild type Q2-87 in modified ABG medium is depicted in form of bars in Miller units with (A) no addition of metals, (B) 25 μM CdII, (C) 50 μM ZnII, (D) 25 μM TPEN or (E) 50 μM EDTA. The secondary y-axis on the right shows the OD600 values of bacterial culture at the time samples were taken (black full circles). See Supplementary Figure S7 for linear growth scale.

