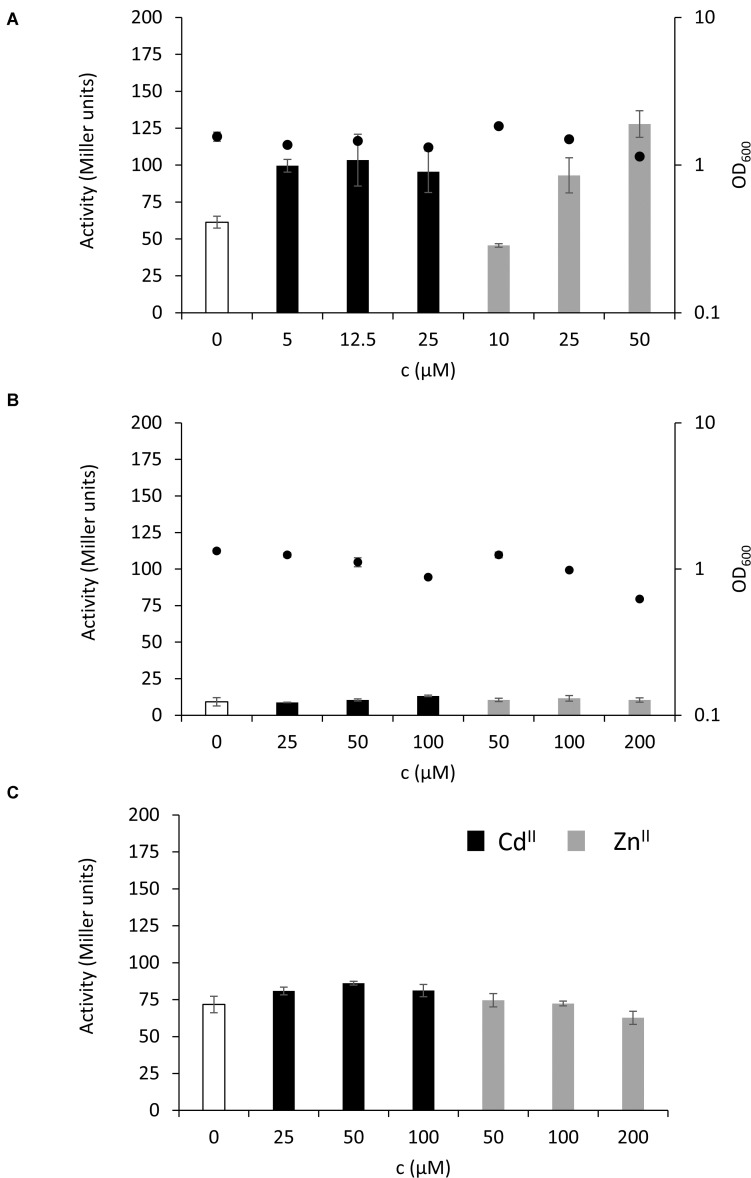
FIGURE 5.
Level of MT expression in the stationary and exponential phase of growth. MT expression without additional metal ions (white bars) or in the presence of different concentrations of ZnII (gray bars) or CdII (black bars) during mid-exponential phase of bacterial growth is given in Miller units and depicted after (A) 48 h incubation or (B) 2 h incubation. In (C) the different concentrations of ZnII or CdII were added after 48 h of bacterial growth followed by 2 h incubation. The secondary y-axis on the right in (A,B) represents OD600 values at the time samples were taken (black full circles). See Supplementary Figure S8 for linear growth scale.

