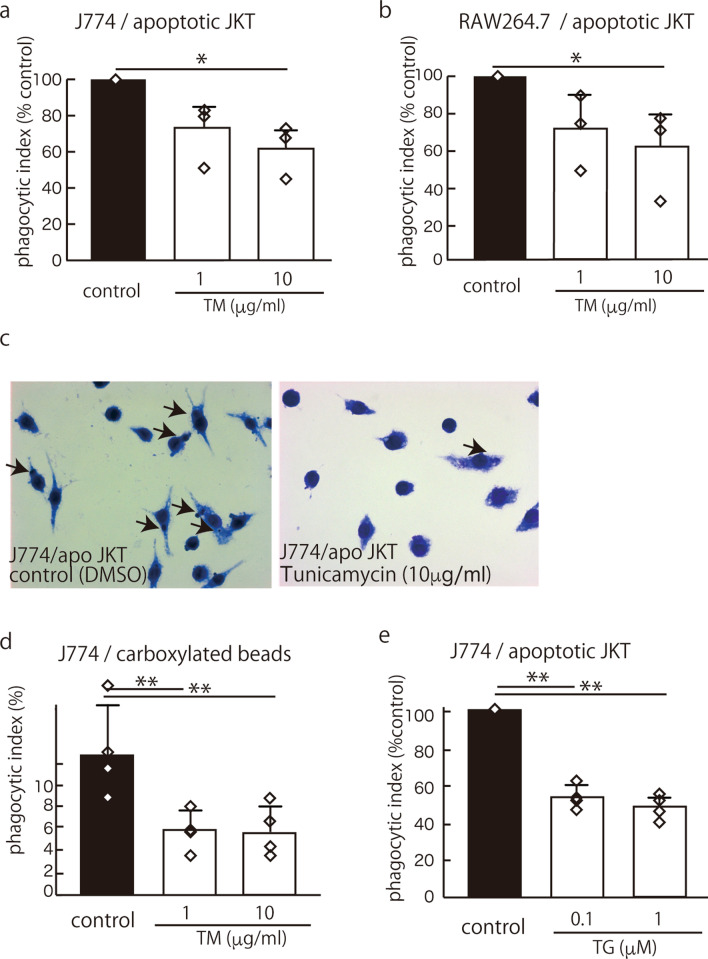
Figure 1.
ER stress caused impaired efferocytosis. After J774 cells (a, c) or RAW264.7 cells (b) were stimulated with 10 μg/ml TM for 6 h, UV-induced apoptotic Jurkat cells or carboxylated beads (d) were added. The mean PI is shown as a percentage of the control ± SEM of three to four replicates per group. The statistical analysis was performed using an ANOVA, followed by Dunnett’s test to compare the groups with an internal control when the ANOVA indicated significance. (a) TM significantly suppressed efferocytosis in the J774 cells (*p < 0.05) (control mean PI, 12.9 ± 3.3) (n = 3). (b) TM similarly suppressed efferocytosis in the RAW264.7 cells (*p < 0.05) (control mean PI, 3.6 ± 2.7) (n = 3). (c) Representative photomicrographs of Diff Quik-stained J774 cells (magnification, ×100) with ingested apoptotic Jurkat cells (arrows). (d) TM (10 μg/ml for 6 h) also significantly inhibited the phagocytosis of carboxylated beads by J774 cells (**p < 0.01) (control mean PI, 12.9 ± 4.4) (n = 4). (e) TG, which induces ER stress by inhibiting an endoplasmic reticulum Ca2+ ATPase inhibitor, also suppressed efferocytosis in the J774 cells (**p < 0.01) (control mean PI, 19.4 ± 14.8) (n = 4).

