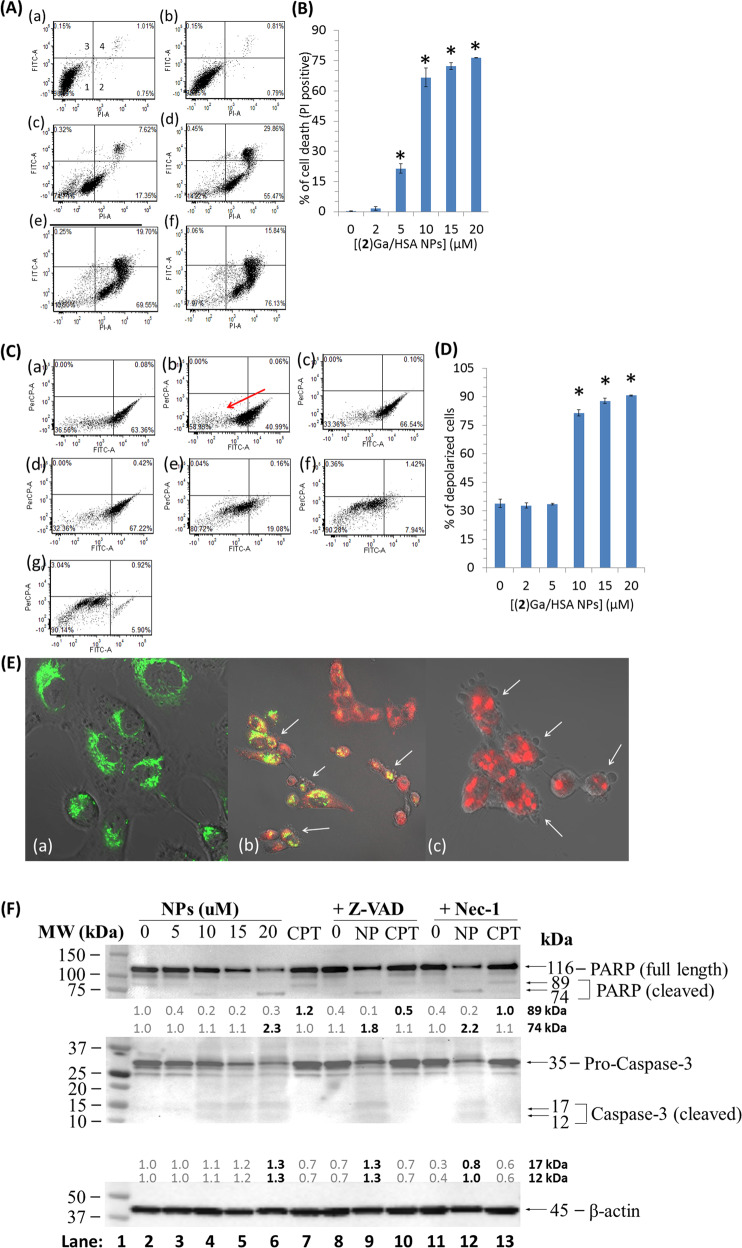
Fig. 3. Detection of (2)Ga/HSA NPs uptake, cell death and disruption of mitochondrial membrane potential in prostate cancer cells.
a AnnexinV-FITC staining of DU-145 cells incubated for 4 h with (a) HSA control and (2)Ga/HSA NPs at the following concentrations: (b) 2 µM, (c) 5 µM, (d) 10 µM, (e) 15 µM and (f) 20 µM. Propidium iodide (PI) was used as a nuclear counterstain to discriminate necrotic/dead cells. Panel 1 (Aa) represents the percentage of live cells (negative for both AnnexinV-FITC and PI). Panel 2 represents necrotic cells (PI positive). Panels 3 (AnnexinV-FITC positive) and 4 (AnnexinV-FITC and PI positive) represent early and late apoptotic/necrotic cells, respectively. b Summary of data sets depicting the percentage of tumor cell that were positively stained for necrosis (i.e., solely PI positive) under the same gating conditions from three distinct experiments; data points represent the means ± SEM (n= 3), *p< 0.001 vs. control untreated cells. c Flow cytometric analysis of DU-145 cells treated with a mitochondrial depolarization reporter kit (MitoProbeTM DiOC2(3)) after 4 h of incubation with: (a) HSA control; (b) CCCP, a protonophore and an uncoupling agent that blocks oxidative phosphorylation (positive control); and (c–g) (2)Ga/HSA NPs at 2, 5, 10, 15, and 20 µM, respectively. Note the red arrow pointing towards the left panel indicating the percentage of mitochondrial depolarization (obtained from CCCP-treated cells). d Summary of data sets depicting the percentage of tumor cells which stained positive for early mitochondrial depolarization (i.e., lower FITC fluorescence) under the same gating conditions from three distinct experiments; data points represent the means ± SEM (n= 3), *p< 0.001 vs. control untreated cells. e Uptake of (2)Ga/HSA NPs by DU-145 prostate cancer cells after 4 h of incubation with: (a) HSA control + 30 min incubation (added to the wells just before imaging) with 200 nM MitoTracker green (MTG) followed by three washes; (2)Ga/HSA NPs at: (b) 5 µM, (c) 20 µM + 30 min incubation with 200 nM MTG and triple washes. Shown are superimposed images of conditions specific for detection of MTG (green fluorescence), (2)Ga (red fluorescence), and phase contrast images of the same field. Fluorescence was recorded using a ×20 objective and a LSM700 confocal microscope supported with Zen software. Samples were excited at 488 nm (3%) for MTG; and at 405 nm (10%) for (2)Ga detection. Representative images of 12 separate fields. White arrows point at possibly apoptotic cells (i.e., those displaying plasma membrane blebbing). f Western blot analysis of proteins isolated from cells pre-treated for 3 h with vehicle control, 50 µM of Z-VAD-FMK or Necrostatin-1. Following pretreatment, cells were incubated for 20 h with (2)Ga/HSA NP (NPs; 5, 10, 15, or 20 µM), NPs (15 µM), or camptothecin (CPT; 5 µM) without the removal of inhibitors. Band intensities were quantified using ImageLab software (Bio-rad) relative to vehicle control in lane 1. Representative results of two experiments are shown.

