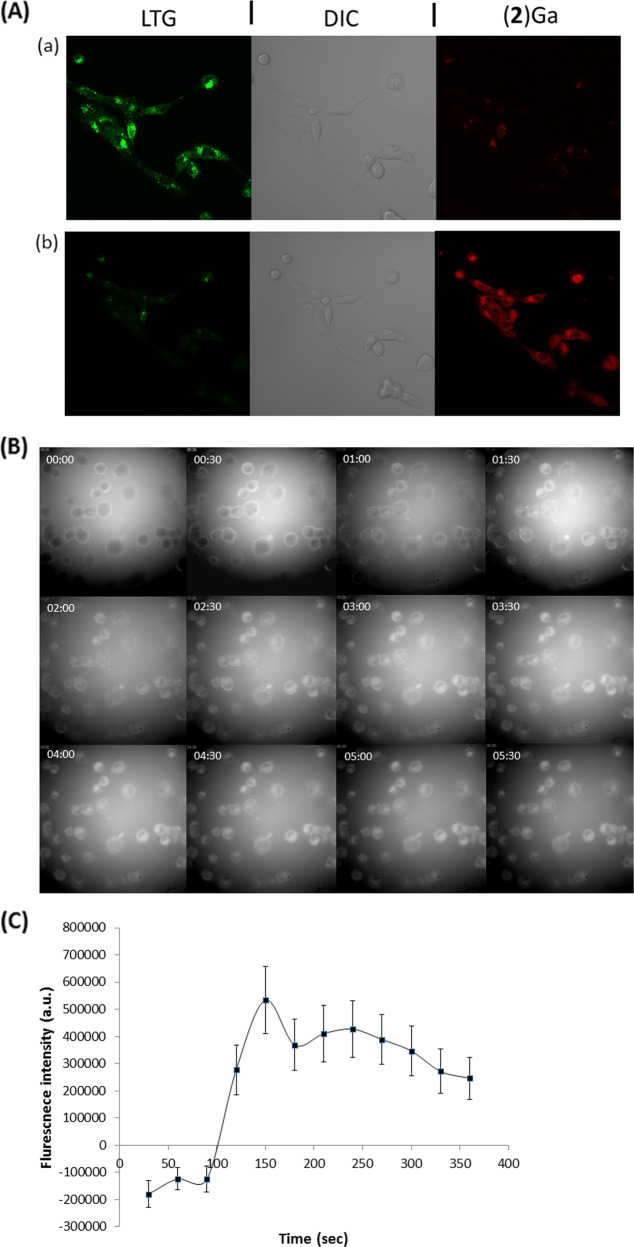
Fig. 5. Kinetic of cellular internalization of (2)Ga/HSA NPs and disruption of lysosome in prostate cancer cells.
a DU-145 cells: (a) after 30 min incubation with LysoTracker green (LTG) (150 nM); (b) same field after consecutive 10 min incubation with (2)Ga NPs (20 µM). Images were taken using conditions for specific detection of LTG (green fluorescence), (2)Ga (red fluorescence) and phase contrast images of the same field. Fluorescence was recorded at ×20 magnification using a LSM700 confocal microscope and Zen software. Samples were excited at 488 nm (3%) for LTG and at 405 nm (10%) for (2)Ga detection. Representative images of 12 separate fields and representative results of 3 independent experiments are shown. b Time-lapse microscopy imaging of (2)Ga/HSA NPs uptake in DU-145 cells: series of images taken at time intervals of 30 s ranging from t= 0 (upper left corner) to t= 6.5 min (lower right corner). The time point is indicated in white on the upper left corner of each image; (c) quantification of fluorescence from the center of each cell in 12 separate fields. Data points are presented as mean ± SEM (n= 6). Fluorescence was recorded using a ×20 objective and an IN Cell analyzer 2000 software (GE Healthcare). Samples were excited using a CFP filter for (2)Ga detection. Representative images of 12 separate fields and representative results of 3 distinct repeats are presented.

