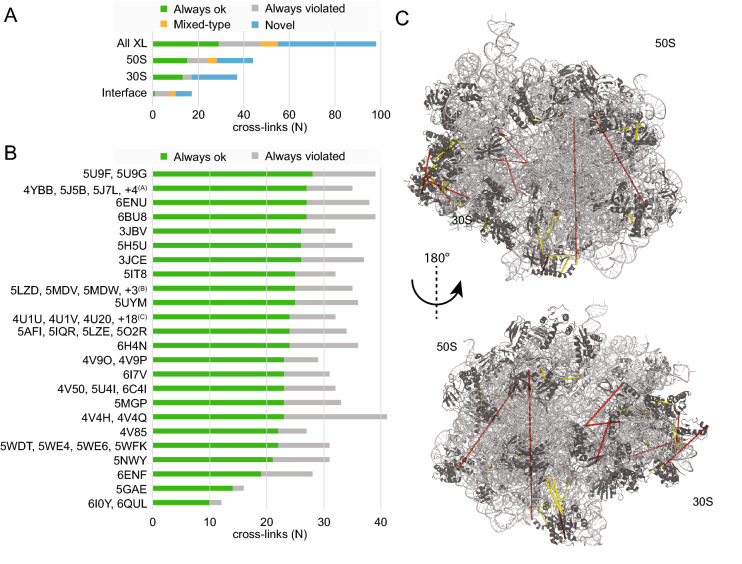
Figure 2.
Statistics of database-wide mapping of ribosomal inter-molecular cross-links. (A) Classification of cross-links. Satisfied: cross-links always in the allowed range; Mixed-typed: cross-links both in the allowed and in the violated range, depending on the ribosome structure; Violated: cross-links always outside the allowed range; Novel: cross-links that could not be mapped on any high resolution ribosomal structure. (B) Classification of mappable cross-links on published structures. PDB IDs (https://www.rscb.org) with the same count of satisfied and violated cross-links are grouped. Pruned pdb-codes: (A)5J88, 5J8A, 5J91, 5JC9; (B)5MDY, 5MDZ, 6HRM; (C)4U24, 4U25, 4U26, 4U27, 4V52, 4V54, 4V57, 4V64, 4V6C, 4V7S, 4V7T, 4V7U, 4V7V, 4V9C, 4V9D, 4WF1, 4WOI, 4WWW. (C) Cross-links on 5U9F, the published structure with the highest number of satisfied cross-links. Cross-links that satisfy the distance range are shown in yellow dashed lines; distances that are violated are shown in red. Ribosomal proteins (black) and rRNA (grey) are shown in cartoon presentation. The images of protein structures were generated with PyMOL (Version 2.3.2), Schrödinger, LCC. URL: https://pymol.org.

