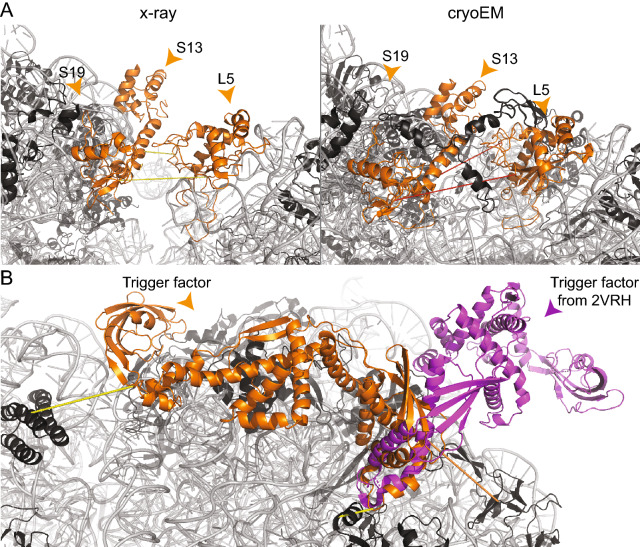
Figure 4.
Visualization of differences in X-ray and cryo-EM structures, identified by cross-links falling in the mixed-type category, and localization of the trigger factor. Ribosomal proteins (black) and rRNA (grey) are shown in cartoon. (A) Capturing the flexibility between the 30S and 50S subunits. In the X-ray structure (4V4H), cross-links #62 and #73 are satisfied (yellow dashed lines); in the cryo-EM-structure (5U9F), a different conformation is visible, which violates the maximum distance (red dashed lines). (B) Structural model of the trigger factor (orange) in complex with the E. coli ribosome. Cross-link satisfaction is indicated as yellow lines, violation as orange lines. The known low-resolution structure (2VRH) is superimposed and shown in magenta. The images of protein structures were generated with PyMOL (Version 2.3.2), Schrödinger, LCC. https://pymol.org.

