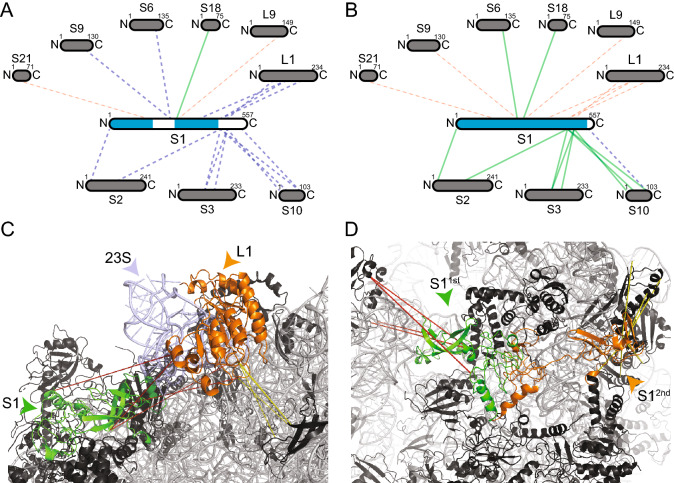
Figure 6.
Identification and remodeling of the interaction network of S1. Interaction network of S1 before (A) and after (B) modeling. Sizes of the boxes are scaled to the length of the protein sequences and blue color in S1 indicates structurally characterized sequence parts. Each line represents one identified cross-link pair. Novel interactions are shown as dashed lines, satisfied (green) and violated (red) cross-link as colored lines. Ribosomal proteins (black) and rRNA (grey) are shown in cartoon. Remodeled proteins are highlighted in color (C, D). Cross-links are shown as dotted lines, and satisfaction (yellow) and violation (red) are also indicated. (C) Structural interaction network of the CTD of S1 (green) and the L1 stalk, formed by L1 (orange) and helices 76–78 of the 23S RNA (light blue). The cross-links between S1 and the L1 stalk show distance violation, but the L1 stalk itself to proteins in vicinity shows both, satisfaction (yellow) and violation (red) of cross-links, indicating different conformations as function of L1 stalk movement (see text for details). (D) Distinct conformations of the CTD of S1 (1st/2nd;green/orange). The 1st conformation (green) recapitulates the interaction of S1 with the L1 stalk in the 50S subunit. The 2nd conformation (orange) recapitulates an interaction with other 30S subunits and satisfies all cross-links. The images of protein structures were generated with PyMOL (Version 2.3.2), Schrödinger, LCC. https://pymol.org.

