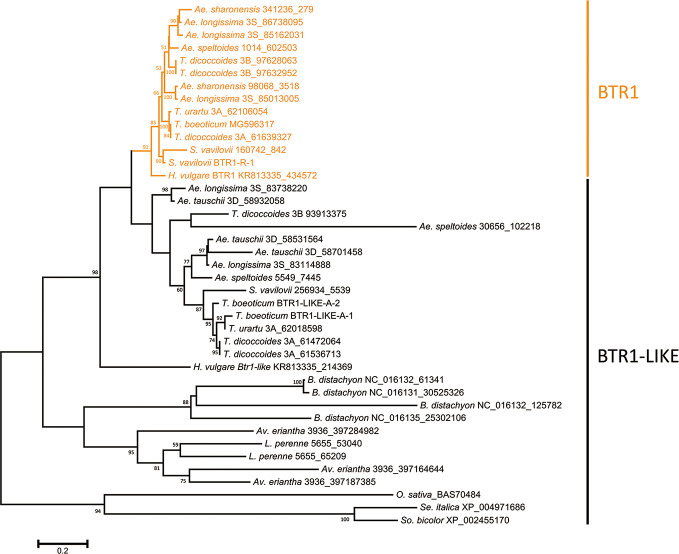
Figure 2.
Phylogeny of the Poaceae BTR1 and BTR1-like proteins. The tree was constructed using the maximum likelihood method based on an alignment of deduced polypeptide sequences. The products of the Btr1 genes are shown in orange. Numbers given at a branch node indicate bootstrap probabilities (only those > 50% are shown). Accession/scaffold/contig numbers and the start location of each gene is given in Table S3.

