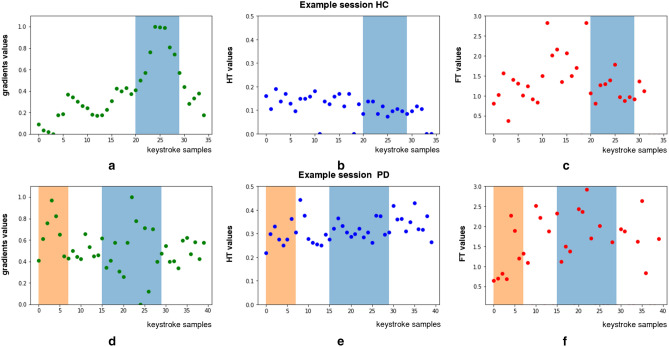
Figure 6.
Attention maps of CNNs shown with respect to the input sequences of HT and FT (top/bottom panels for HC/PD of two cases from the TS1 dataset, respectively). Top panel-HC case: (a) activation of CNN, (b) HT values, (cc) FT values; Bottom panel-PD case: (d) activation of CNN, (e) HT values, (f) FT values. Each sample represents a datum of the keystroke typing session, whereas the shadowed areas (blue and orange) denote the sample range that the neural-network model is using to make the prediction for the typing session.

