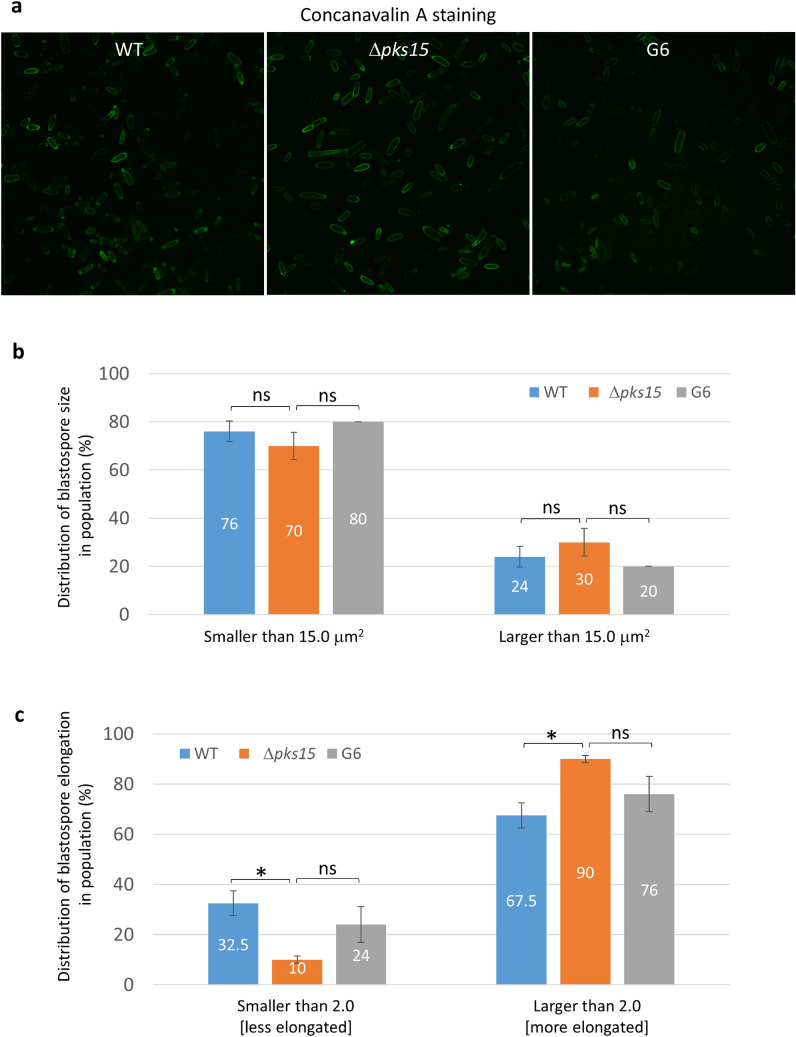
Figure 6.
Size and shape of fluorescently-stained blastospores in the wild type (WT), Δpks15 and the complemented isolate G6. (a) FITC-tagged concanavalin A staining. Bars, 5 μm. (b) Frequency of blastospore sizes for each of the three strains. (c) Frequency of blastospore elongation for each of the three strains. Data shown are mean ± S.E.M. Asterisks indicate statistical significance between the wild type or the complemented isolate G6 and Δpks15 (Student’s t-test: *p < 0.05; ns not significant).

