Figure 2.
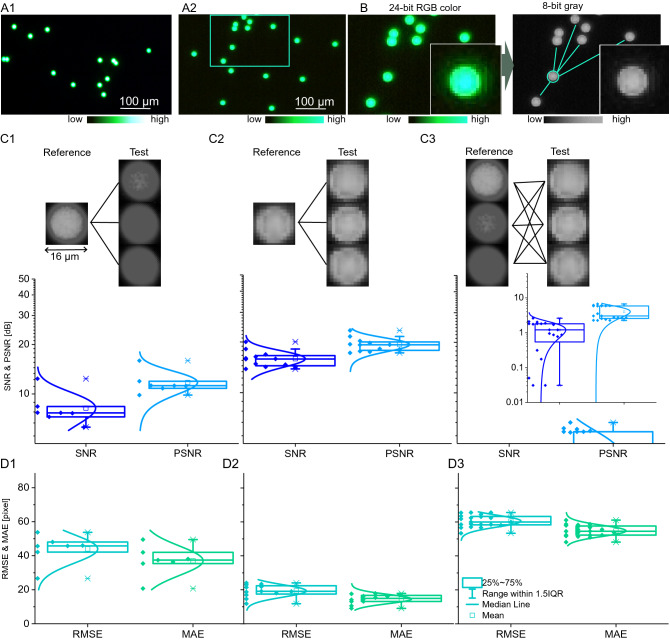
Digital fluorescent imaging is comparable to high-end fluorescent microscopy at the single-cell level. (A1) Magnified fluorescent images of green-fluorescent beads (15.65 µm) imaged with a high-end fluorescent optical microscope (40x) and (A2) the digital microscope (220x). (B) Large-scale comparison of fluorescent image uniformity and signal-to-noise ratio was performed on grey-scale, 8-bit images, which were down-sampled from multi-colour 24-bit RGB colour images. (C1–D3) Comparison tests were performed on individual green-fluorescent beads in relation to near-distance (< 1 mm) neighbouring beads based on a signal-to-noise ratio (SNR), a peak signal-to-noise ratio (PSNR), a mean absolute error (MAE), and a root-mean-square error (RMSE). (C1–C2) Boxplots show distribution of image quality based on SNR and PSNR for (C1) the high-end fluorescent optical microscope (n = 10), and for (C2) the low-cost digital microscope (n = 10). (C3) Randomized inter-comparison of SNR and of PSNR of fluorescent bead appearance between high-end optical and low-cost digital microscopy (n = 10). (D1–D2) Boxplots show distribution of image quality based on MAE and RMSE for (D1) the high-end fluorescent optical microscope (n = 10), and for (D2) the low-cost digital microscope (n = 10). (D3) Randomized inter-comparison of SNR and PSNR of fluorescent bead appearance between high-end optical and low-cost digital microscopy.

