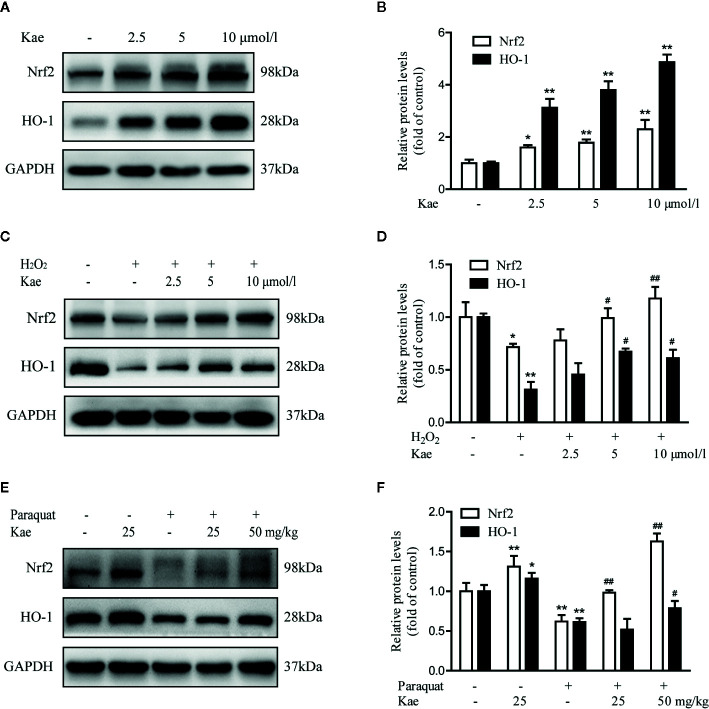
Figure 5.
The effect of Kae on the Nrf2/HO-1 signaling pathway. (A, B) The effect of Kae on the levels of Nrf2 and HO-1 in HUVECs. (C, D) The effect of Kae and 100 μmol/l H2O2 on the levels of Nrf2 and HO-1 in HUVECs. (E, F) The effect of Kae and paraquat on the levels of Nrf2 and HO-1 in mice. Data are expressed as the mean ± standard deviation of three independent experiments. *P < 0.05 and **P < 0.01, compared with the control group. #P < 0.05 and ##P < 0.01, compared with the model group.

