Fig. 3.

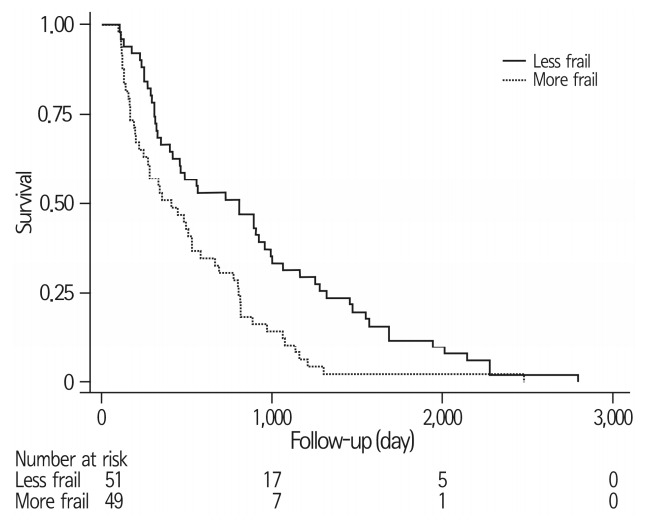
Survival curve of the 100 patients in the less frail group (FRAIL-NH ≤10) and more frail group (FRAIL-NH >10). A significant difference was observed in the survival duration, with a p-value of 0.002.

Survival curve of the 100 patients in the less frail group (FRAIL-NH ≤10) and more frail group (FRAIL-NH >10). A significant difference was observed in the survival duration, with a p-value of 0.002.