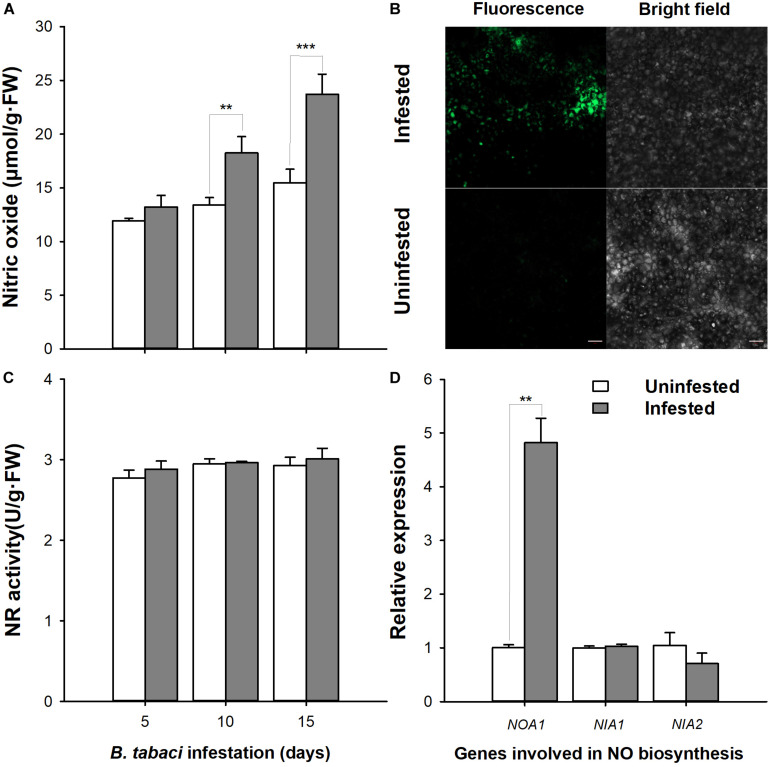
FIGURE 1.
Quantification of nitric oxide (NO) levels, NO synthase activities, and gene expression in Bemisia tabaci nymph-infested tobacco plants. (A) NO production was determined by spectrophotometry after B. tabaci nymph infestation. (B) NO production was estimated using the fluorescence indicator 4-amino-5-methylamino-2′,7′-difluorofluorescein diacetate after B. tabaci nymph infestation. (C) NR activity levels in tobacco plants infested with B. tabaci nymphs. (D) NOA1, NIA1, and NIA2 expression levels in tobacco plants infested with B. tabaci nymphs. Bar = 50 μm. The values are means (±E) of six biological replicates. The asterisks above the bars indicate significant differences (∗∗P < 0.05, ∗∗∗P < 0.001).

