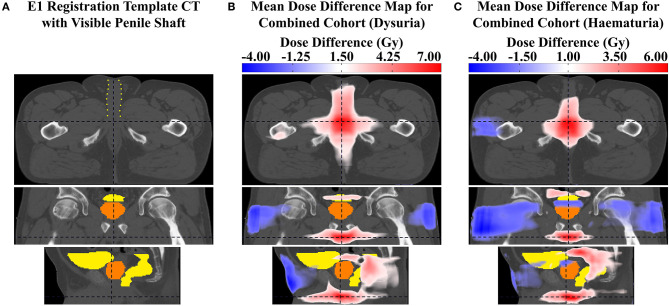
Figure 2.
(A) slices of the T1 registration template CT image with the penile shaft (containing the spongy urethra) visible despite not being delineated, outlined in yellow dots. Mean dose difference maps between patients with and without (B) grade ≥ 2 dysuria and (C) grade ≥ 1 haematuria, on approximately the same urethral slice as the image in (A) for comparison. It is evident that maximum dose difference is most likely occurring at the urethra.

