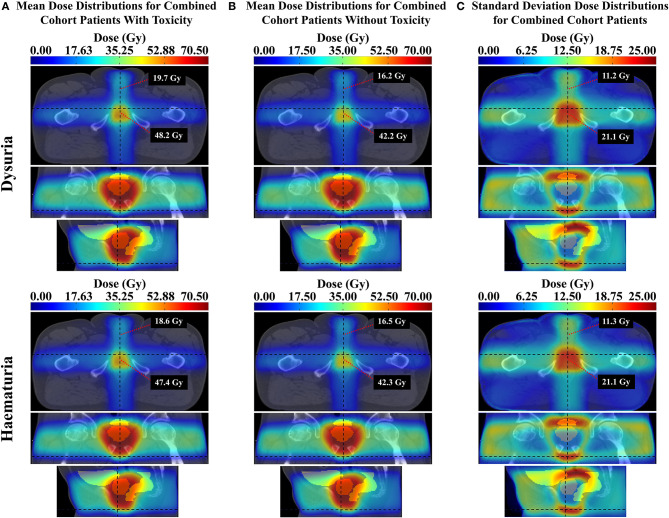
Figure 7.
(A) Mean dose distributions for patients with the given toxicity in the combined cohort, (B) mean dose distributions for patients without the given toxicity in the combined cohort, and (C) standard deviation dose distributions maps for patients in the combined cohort dataset for the given toxicity. Each map displays the dose value at a point in the vicinity of the distal spongy urethra (above) and membranous urethra (below). The top row represents the grade ≥2 dysuria dataset and the bottom row the grade ≥1 haematuria dataset.

