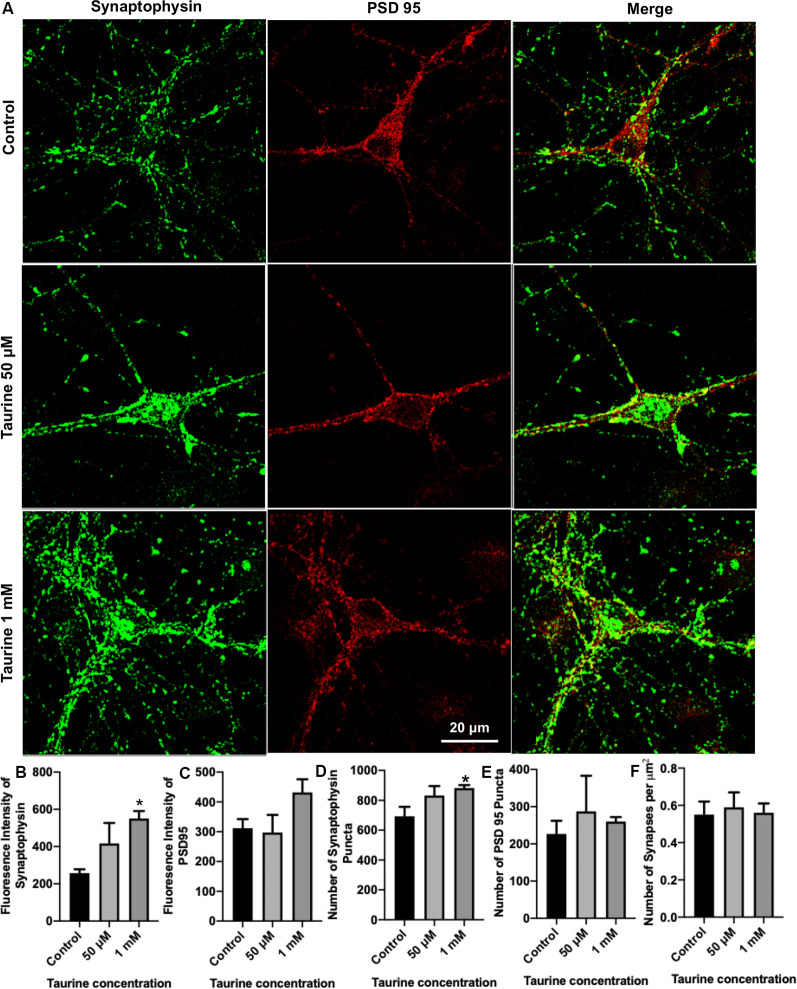
Figure 3.
Taurine enhances the expression of presynaptic protein and presynaptic puncta in rat cortical neurons. Cortical neurons were cultured with 50 μM taurine, 1 mM taurine, or without taurine (control) for 10 days to allow for the development of mature networks. On day 10, cells were fixed and stained with antibodies against the presynaptic vesicle protein synaptophysin and the postsynaptic receptor density protein PSD95. Images were acquired using confocal microscopy and whole networks (entire fluorescent images) were analyzed for synaptic protein intensity, puncta, and colocalization. (A) Representative immunofluorescent images show the staining of synaptic proteins of control, 50 μM, 1 mM taurine-treated cortical neurons. (B,C) The addition of 1 mM taurine to culture media significantly increased the intensity of synaptophysin expression while not significantly altering PSD95 intensity. Specifically, the fluorescent intensity of synaptophysin in control was 257.6 ± 20.7, in taurine at 50 μM was 417.3 ± 110, and in taurine at 1 mM was 551.1 ± 39.6 (p = 0.02 for control vs. 1 mM taurine). The fluorescence intensity of PSD95 in control was 311.9 ± 30.5, in taurine at 50 μM was 297.1 ± 59.5, and in taurine at 1 mM was 431.9 ± 44.3 (p = 0.108). (D,E) The number of presynaptic synaptophysin and postsynaptic PSD95 puncta in a fluorescent image was measured by the ImageJ plugin SynQuant. The only significant change in puncta number occurred after 1 mM taurine treatment for synaptophysin puncta. Specifically, the number of synaptophysin puncta in control was 692.8 ± 63.3, in taurine at 50 μM was 832.3 ± 63.3, and in taurine at 1 mM was 881.7 ± 20.7 (p = 0.03 for control vs. 1 mM taurine). The number of PSD95 puncta in control was 226.8 ± 35.3, in taurine at 50 uM was 287.5 ± 95.6, and in taurine at 1 mM was 260.2 ± 11.8 (p = 0.743). (F) SynapCountJ, an ImageJ plugin, was utilized to determine synapses (per μm2) via colocalization of synaptophysin and PSD95 in traced neurites. There was no significant difference in the number of synapses between any treatments. Control cell number of synapses (per μm2) was 0.55 ± 0.07, 50 μM taurine was 0.59 ± 0.08, and 1 mM taurine was 0.56 ± 0.05 (p = 0.904; n = 4 images for control and 50 μM taurine-treated neurons; n = 6 images for 1 mM taurine-treated neurons; the statistical test was one-way ANOVA in all cases). *Indicates a significance level of p < 0.05 vs. control.

