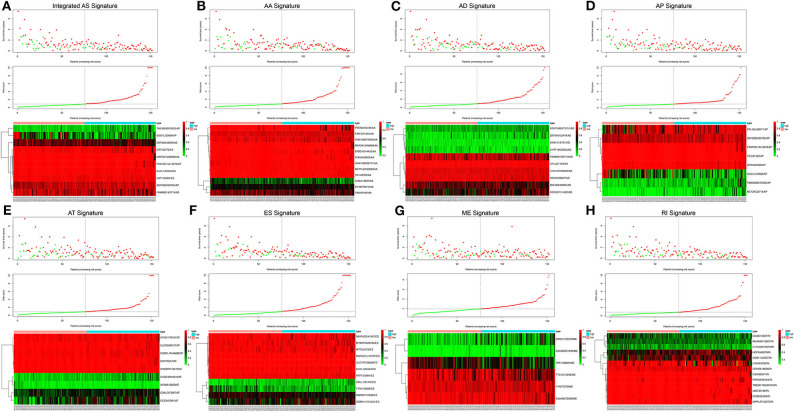
Figure 4.
Risk score analysis of the integrated AS signature and the 7 type-specific AS signatures in GBM patients. Upper panel (A–H) Patient survival status and time distributed by risk score. Middle panel (A–H) Risk score curve of the AS signature. Bottom panel (A–H) Heatmaps of prognosis-related AS events. Colors ranging from green to red indicate expression levels ranging from low to high. The dotted line represents the individual inflection point of the risk score curve, by which the patients were categorized into low-risk and high-risk groups.

