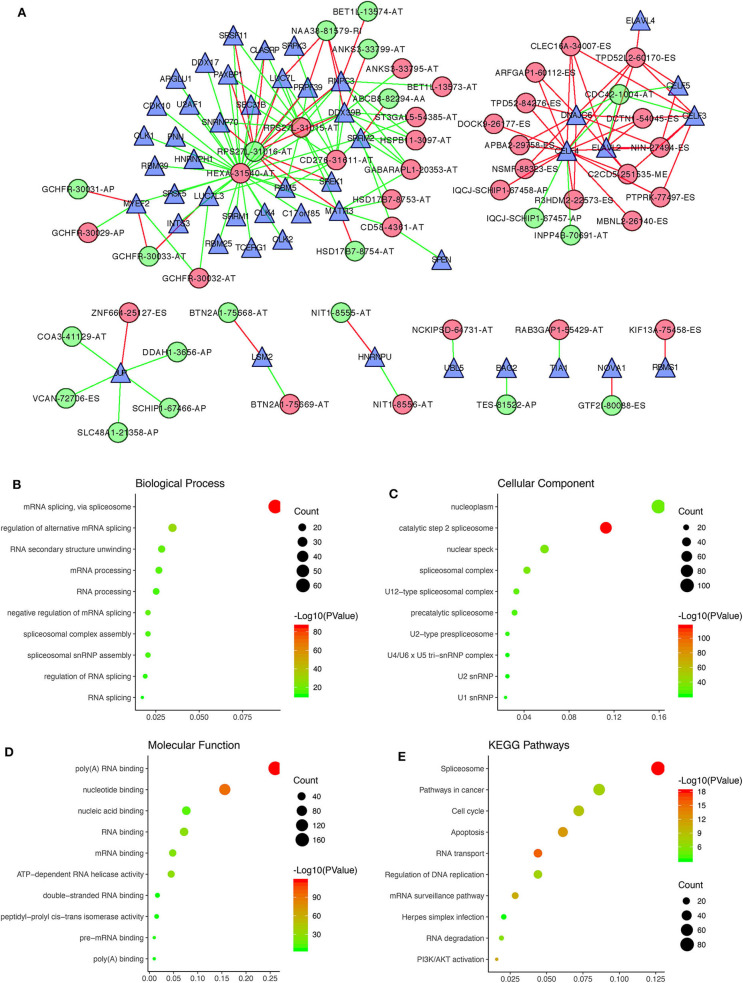
Figure 7.
Correlation analysis between prognostic AS events and SFs. (A) The regulatory network between 47 survival-associated SFs and 52 survival-associated AS events, with |Pearson correlation coefficient| > 0.6 and P < 0.001. Green and red dots, respectively, represent favorable and unfavorable prognostic AS events. Green and red lines, respectively, represent negative and positive correlations between AS events and SFs. Blue triangles represent SFs. (B–E) Functional enrichment analysis of the 392 SF genes having |Pearson correlation coefficient| > 0.4 with prognostic AS events.

