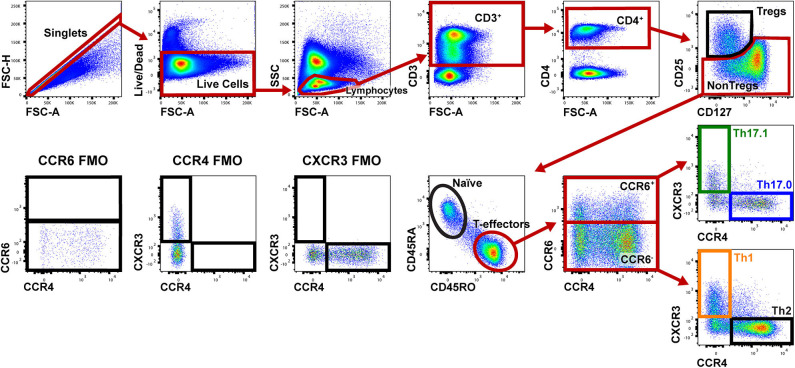
Figure 1.
Gating strategy to identify Th populations among T-effector cells. Shown is a representative sarcoidosis subject sample. We gated on singlet cells using FSC-H and FSC-A, then live cells (negative for the fixed viability dye), lymphocytes based on FSC and SSC, then CD3+ and CD4+ cells. We then gated on NonTregs that were CD25−and either CD127Lo or CD127Hi and then T-effectors (CD45RA− and CD45RO+). Among these T-effectors, we enriched for Th subsets using CCR6, CCR4, and CXCR3. Th17.0 cells were CCR6+CCR4+CXCR3−, Th17.1 cells were CCR4−CCR6+CXCR3+ and Th1 cells were CCR6−CCR4−CXCR3+. The gating strategy used for fluorescence minus one (FMO) controls for CCR6, CCR4, and CXCR3 are shown in the lower left corner.

