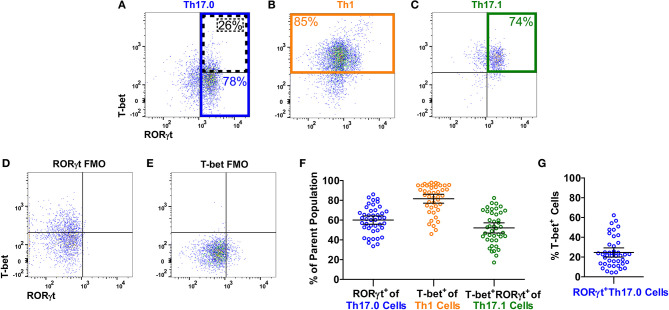
Figure 2.
T-bet and RORγt expression in the Th17.0, Th1, and Th17.1 cell populations. For each Th population (as defined in Figure 1), we determined the expression of T-bet and RORγt, as shown in a representative sarcoidosis sample. Expression of T-bet and RORγt in (A) Th17.0, (B) Th1, and (C) Th17.1 cells along with fluorescence minus one controls (FMOs) for (D) RORγt and (E) T-bet are displayed as dot plots. The majority of cells in each Th population had the expected expression pattern of T-bet and RORγt based on its chemokine receptor pattern: (A) the majority of Th17.0 cells expressed RORγt (outlined in blue); (B) the majority of Th1 cells expressed T-bet (outlined in yellow); and (C) the majority of Th17.1 cells expressed both RORγt and T-bet (outlined in green). These frequencies of RORγt+ and/or T-bet+ cells in each of these Th cell populations for this representative subject sample are shown on each plot with corresponding colors. These frequencies are displayed graphically in (F) across all subjects where each open circle represents a single subject along with the mean and 95% confidence interval (CI). Our primary population of interest in this study was the Th17.0 subset, so to achieve the highest specificity for the “Th17.0” phenotype, we focused on RORγt+Th17.0 cells as outlined in blue in (A). We found that some of these RORγt+Th17.0 cells also expressed T-bet, as outlined by the dotted black box in (A). There was a range of T-bet+ cells within this RORγt+Th17.0 population across subjects, as shown graphically in (G), where each open circle represents a subject along with the mean and 95% CI. Our subsequent analyses focused on how this T-bet+ frequency among RORγt+Th17.0 cells related to clinical sarcoidosis outcomes.

