Figure 3.
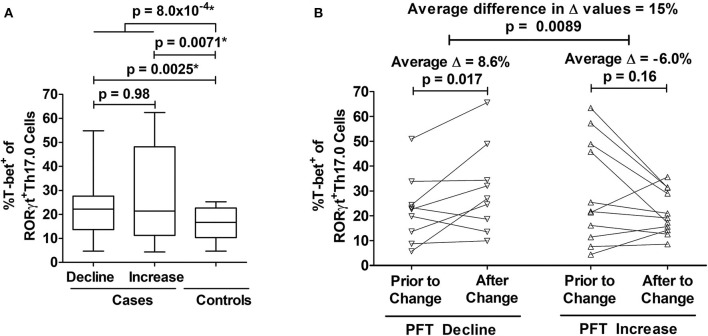
Associations between T-bet+ frequencies of RORγt+Th17.0 cells and pulmonary function changes. (A) Cases had higher %T-bet+ frequencies of RORγt+Th17.0 cells compared to controls in either adjusted or unadjusted models (*p-values from model adjusted for age, sex, race, immunosuppression use, and prior smoking). Cases were defined by declines (n = 22) or increases (n = 11) in either forced vital capacity (FVC) or diffusing capacity (DLCO) of 10 or 15%, respectively during follow up regardless of immunosuppression. Controls (n = 10) lacked these same pulmonary function test (PFT) changes and never required immunosuppressive treatment. The upper most p-value represents the result from a regression model that compared all cases to controls. The middle two p-values represent results from a regression model that distinguished cases as separate groups based on either PFT declines or increases and compared these groups to controls; the lower most p-value represents the results from this same regression model where cases with PFT declines were compared to cases with PFT increases. Data are displayed as box-and-whisker plots with median and interquartile ranges. (B) As assessed by mixed effects modeling adjusted for age, sex, race, immunosuppression use, and prior smoking, cases had either an increase (n = 9) (left panel) or decrease (n = 11) (right panel) in T-bet+ frequencies at the visit at which their PFT change occurred. The difference in the magnitude of these changes between those with PFT declines and PFT increases was 15%. In (B), each subject's T-bet+ frequency is represented by an open symbol and are plotted based on when they were sampled relative to the PFT change.

