Figure 2.

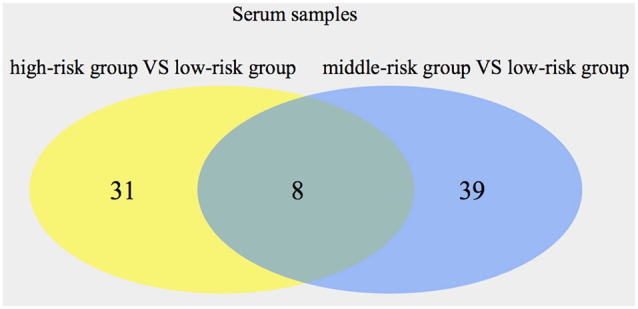
Numbers of significant metabolites comparing the high-risk group with the low-risk group, as well as the middle-risk group with the low-risk group, in serum. The intersection of the metabolites is also presented.

Numbers of significant metabolites comparing the high-risk group with the low-risk group, as well as the middle-risk group with the low-risk group, in serum. The intersection of the metabolites is also presented.