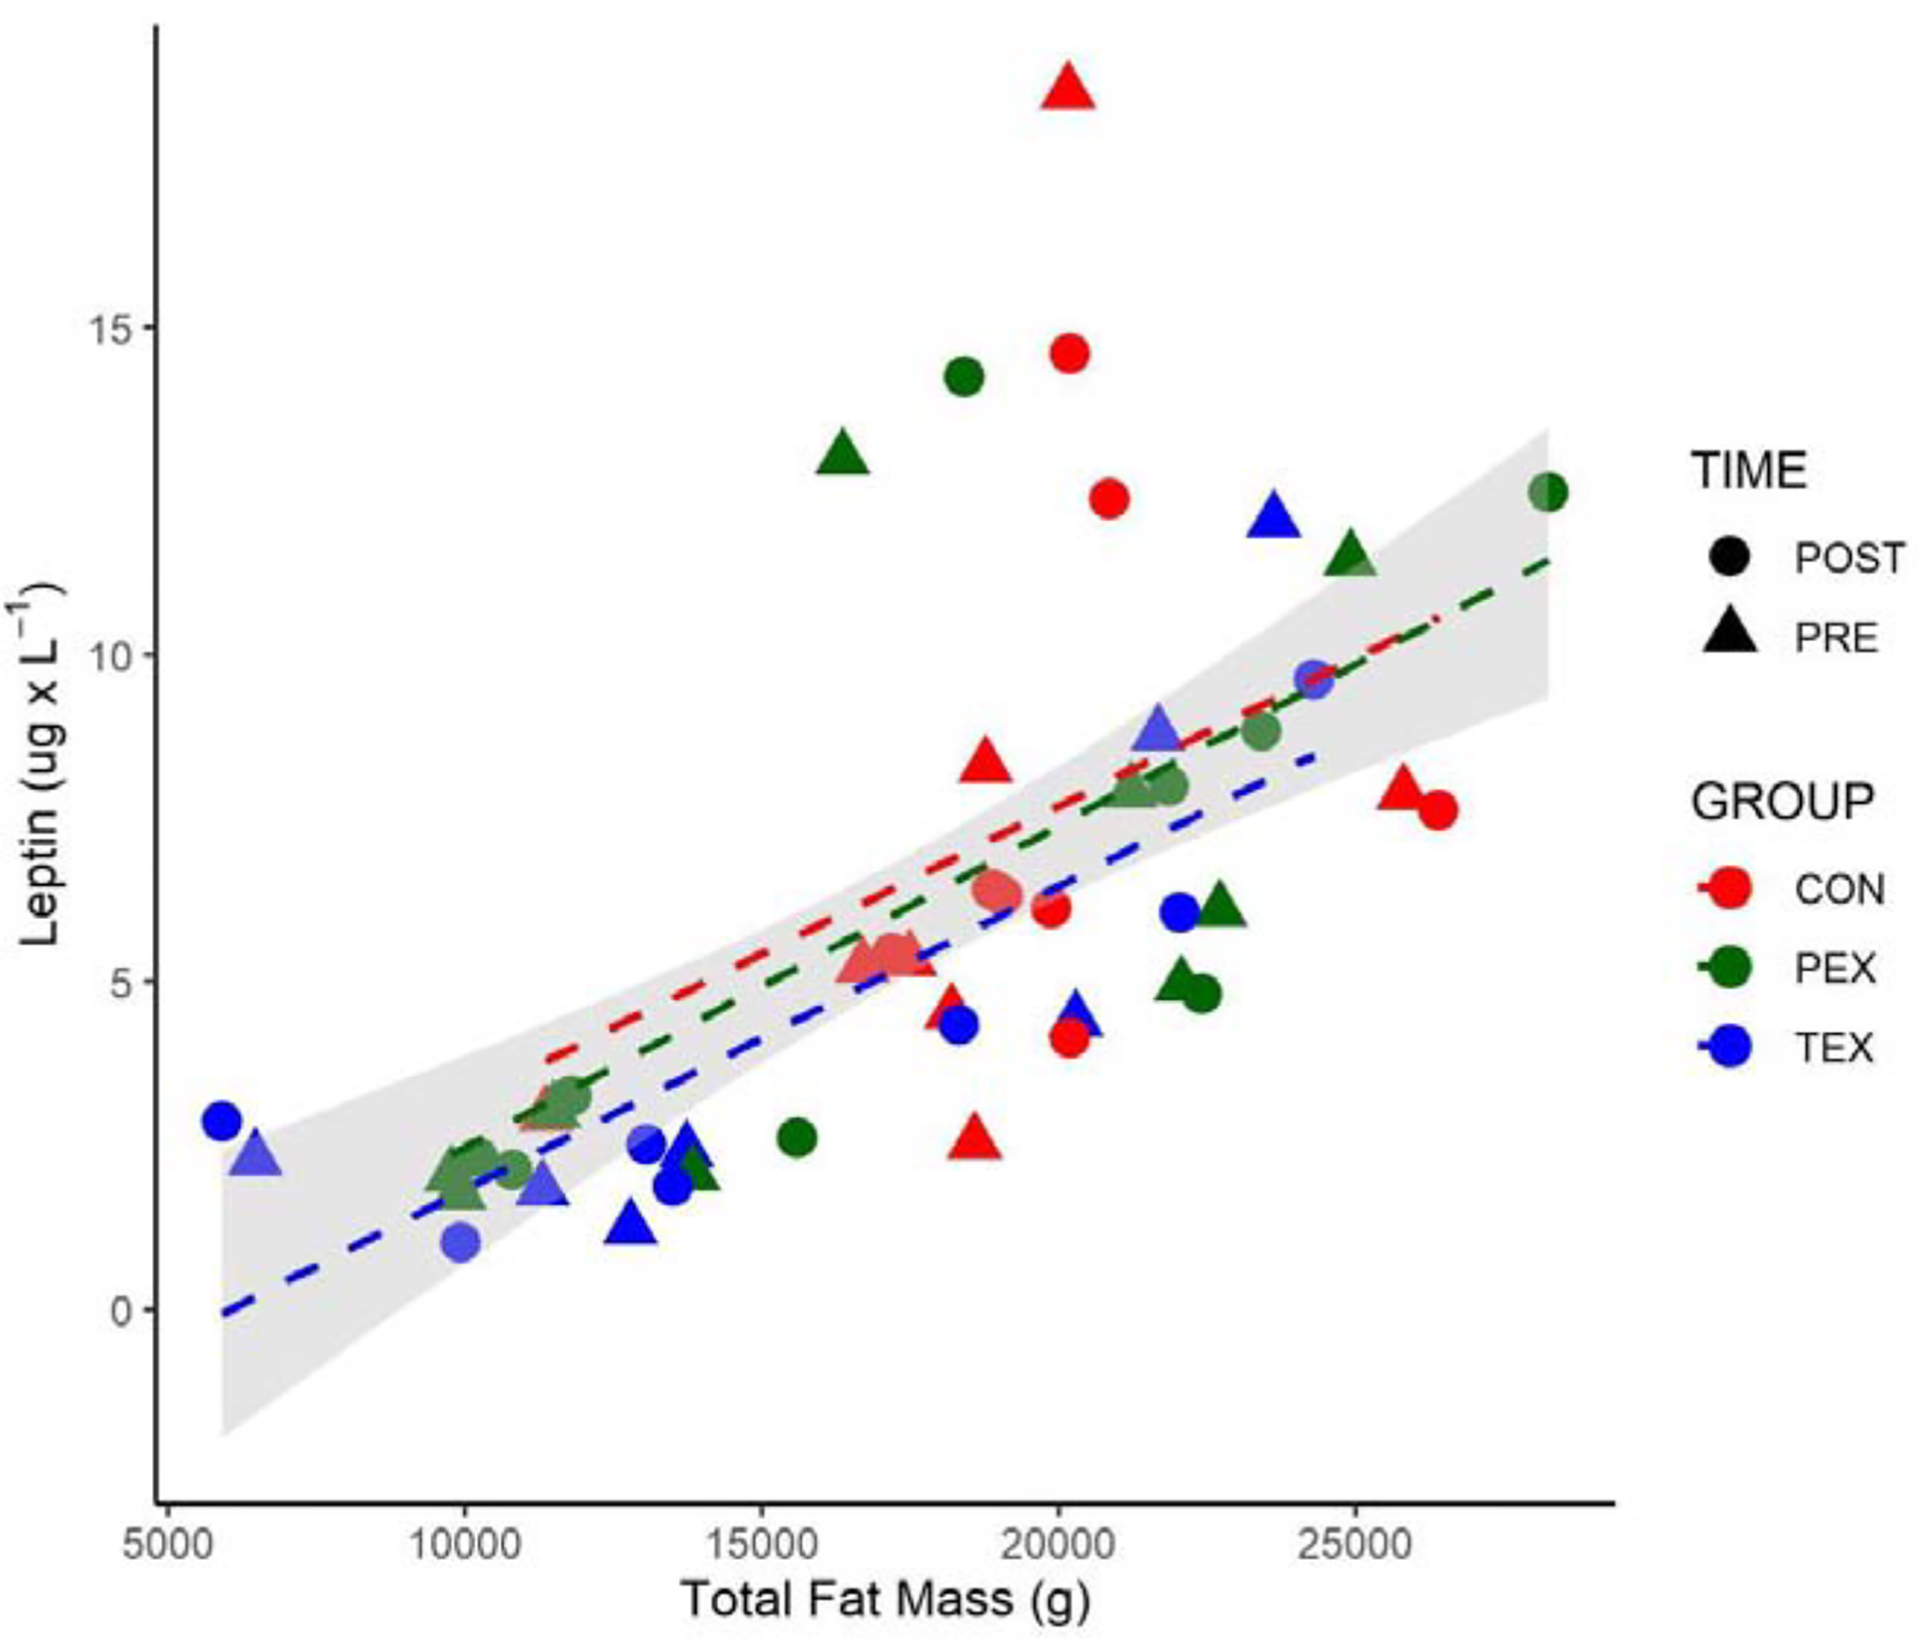
Figure 1. Total Body Mass vs. Leptin.

Total fat mass (g) vs. circulating leptin measurements (ug· L−1) before HDBR (triangle) and after HDBR (circle). Gray area represents 95% CI of the linear model regression for all points (Pearson r = 0.6542, p < 0001). For visualization, groups with regression lines are identified as follows: CON (red), PEX (green), and TEX (blue).
