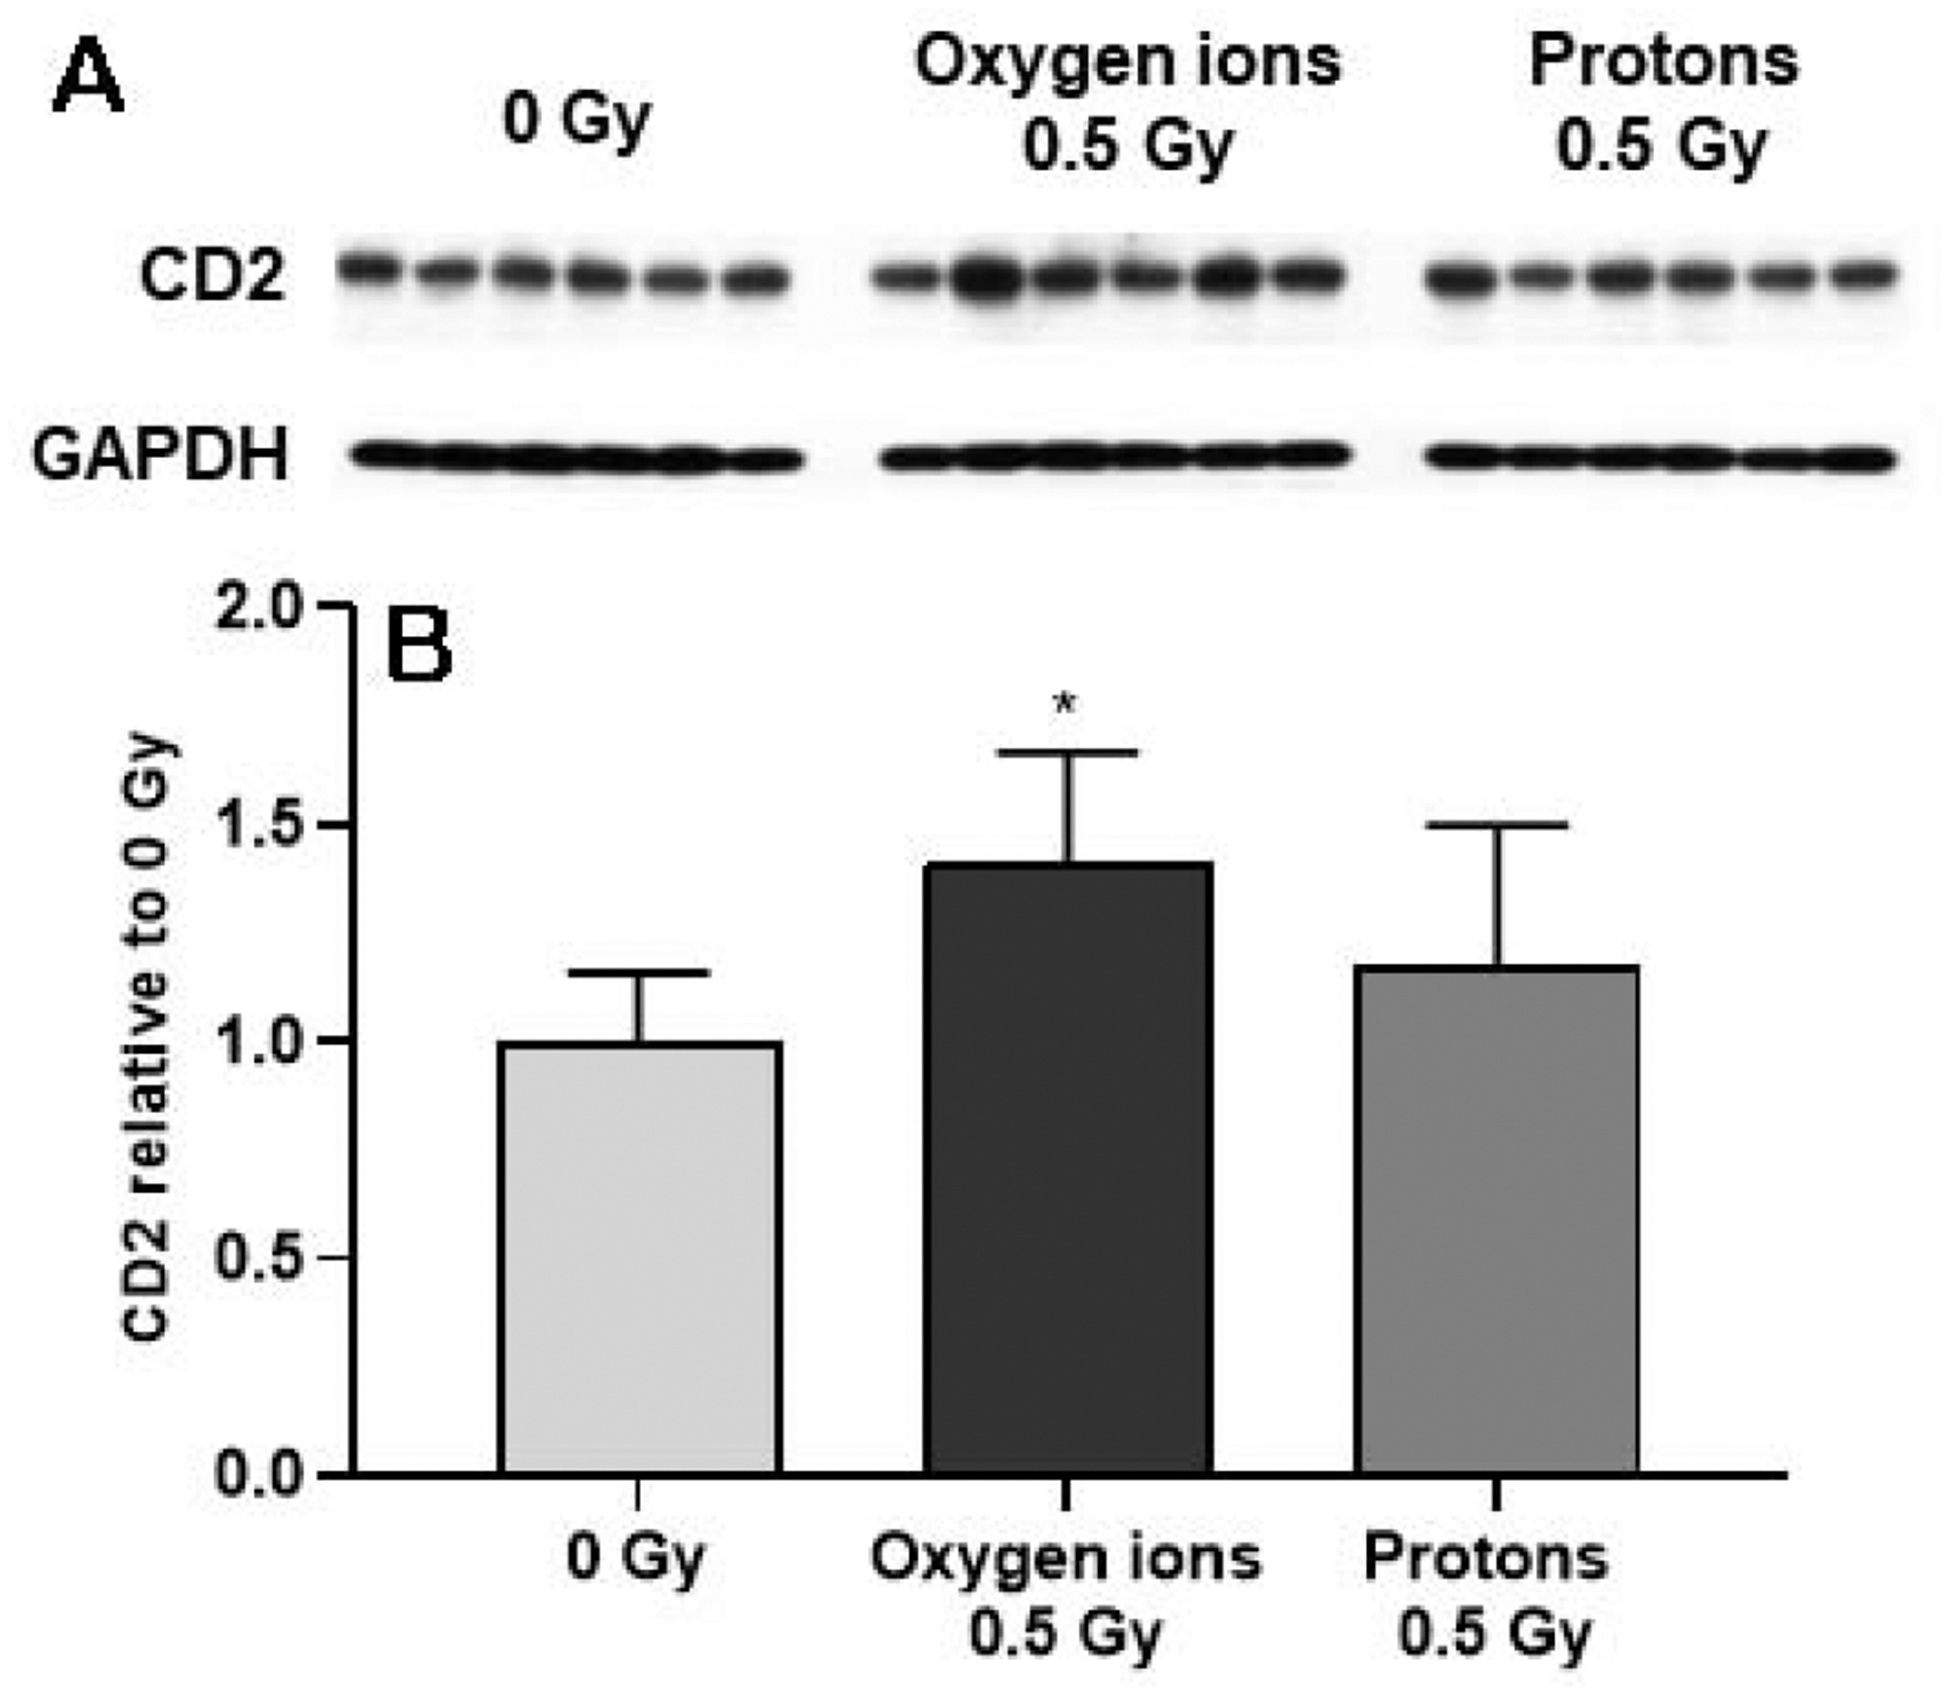
Figure 2. Western-blot analysis of CD2 in the left ventricle.

The levels of CD2 were quantified (A), normalized to GAPDH and then calculated relative to age- and time-matched 0 Gy controls (B). Samples of left ventricle were assessed at 12 months after oxygen ions (600 MeV/n) and protons (250 MeV), n=8 rats in 0 Gy and n=10–12 rats in the 0.5 Gy groups. Bars indicate average and SD. *p < 0.05 compared to age- and time-matched 0 Gy.
