FIG 3.
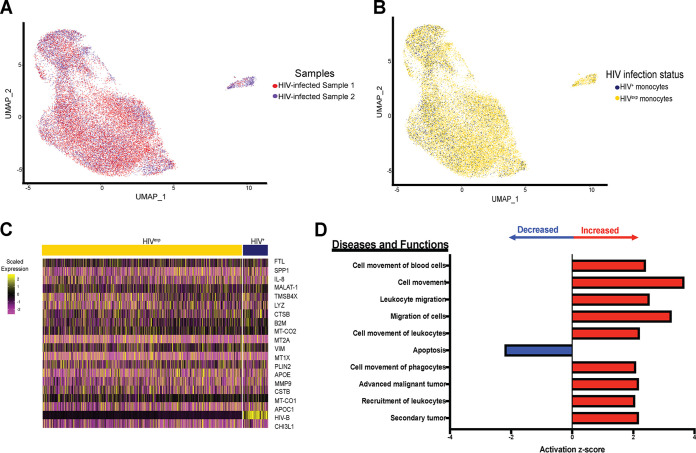
HIV+ and HIVexp mature monocytes have altered expression of genes related to cell movement of HIV+ mature monocytes. (A and B) UMAP plots of HIV-infected mature monocytes from 2 different donors after integration of data sets and alignment. (A) Data are color coded by biological sample (red, HIV-infected sample 1; blue, HIV-infected sample 2). (B) Data are color coded by HIV infection status (HIV+ in blue, HIVexp in yellow). (C) Heat map of top 20 DE genes in HIV+ relative to HIVexp mature monocytes. The scaled expression of genes (rows) across HIV infection status (columns) is shown. (D) Top 10 diseases and functions predicted to be increased (red) or decreased (blue) in HIV+ relative to HIVexp by IPA of DE genes.

