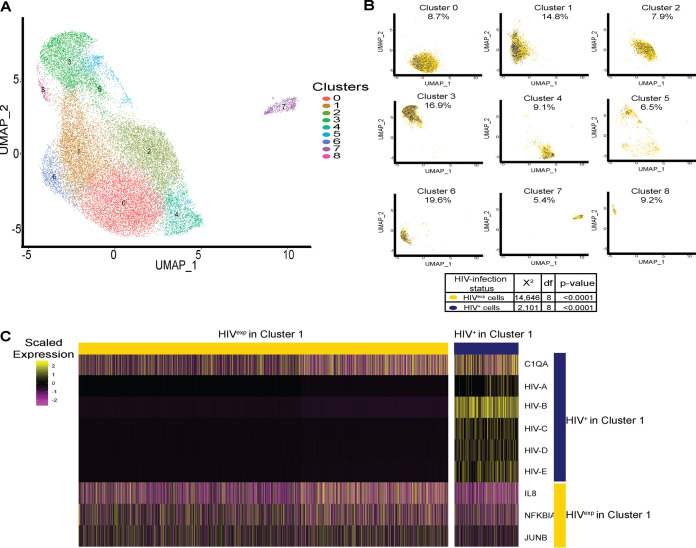
FIG 4.
Percentages of HIV+ mature monocytes are different depending upon the cluster being examined. (A) UMAP plot of HIV-infected mature monocytes without ART from 2 different donors after integration of data sets and alignment, detecting 9 clusters of mature monocytes. (B) UMAP plot of HIV-infected mature monocytes color coded by HIV infection status (HIV+ in blue, HIVexp in yellow) split by monocyte cluster. After alignment and integration, the percentages of HIV+ mature monocytes were different in each cluster. (C) Representative heat map of DE genes between HIV+ and HIVexp mature monocytes from cluster 1. The scaled expression of genes (rows) across HIV infection status (columns) is shown.

