FIG 5.
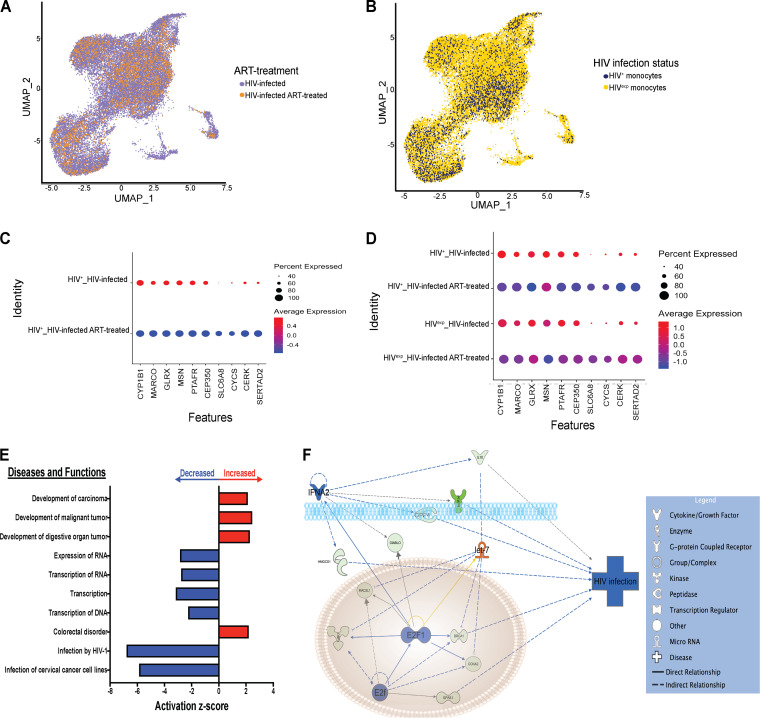
ART downregulates genes in HIV+ mature monocytes, decreasing HIV infection by modulating upstream regulators E2F, E2F1, IFNA2, and let-7. (A) UMAP plot of HIV-infected mature monocytes with and without ART after integration and alignment of data sets. (A) Data are color coded by treatment status (HIV-infected samples in purple, HIV-infected ART-treated samples in orange). (B) Data are color coded by HIV infection status (HIV+ in blue, HIVexp in yellow). (C and D) Differential gene expression testing on integrated analysis showed DE genes in HIV+ cells with or without ART (C), and there was a trend indicating that expression levels of these same genes were decreased in HIVexp cells with or without ART. (D) The size of each circle represents the percentage of cells in the cluster where the gene was detected. Color intensity reflects average expression within clusters (based on infection status and ART). (E) IPA diseases and functions of DE genes in HIV+ cells whose expression levels were predicted to be increased (red) or decreased (blue) in HIV+ cells with ART relative to HIV+ without ART (top 10 shown). (F) IPA network and upstream regulators associated with ART decrease of HIV infection. Upstream regulators are indicated in orange when leading to activation of downstream genes or functions or in blue when leading to inhibition. Genes whose expression levels were decreased with ART are indicated in green. Color intensity reflects average scaled expression.

