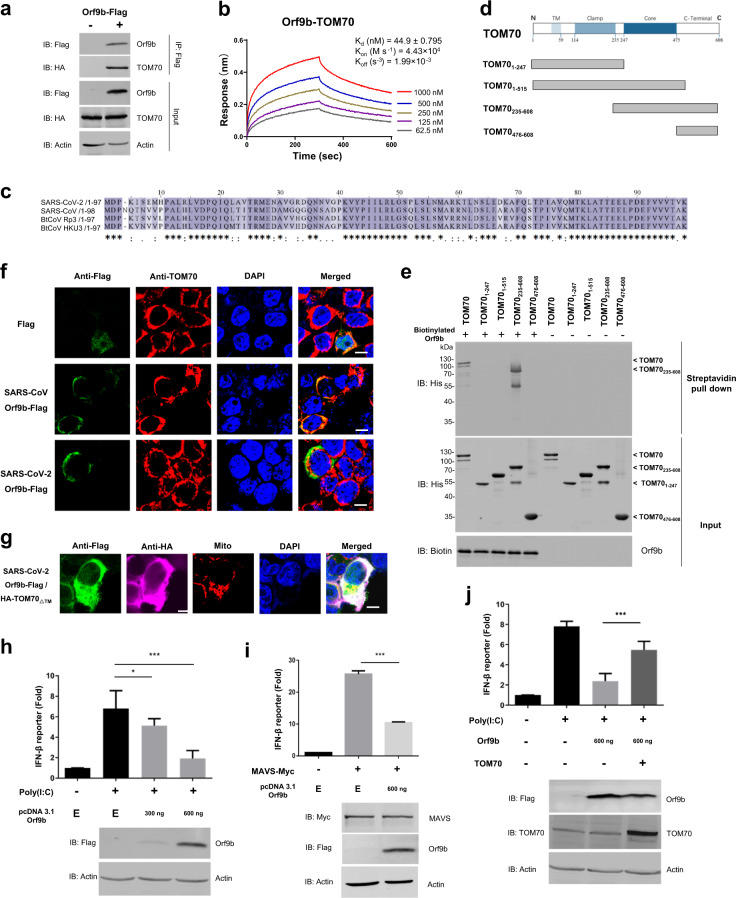
Fig. 1. SARS-CoV-2 Orf9b suppresses type I interferon responses by targeting TOM70.
a Co-immunoprecipitation of Orf9b-Flag with HA-TOM70 from HEK 293T cells. Immunoprecipitation (IP) was performed using anti-Flag magnetic beads. b BLI data for the binding of Orf9b to TOM70 and their interaction kinetics. Biotinylated Orf9b was immobilized on streptavidin-coated biosensors and exposed to TOM70 in SD buffer (1× PBS, pH 7.4 with 0.02% Tween-20 and 0.1% BSA). Binding was measured by coincident changes in the interference pattern. c Alignment of Orf9b from SARS-like coronaviruses. Sequences were compiled from the National Center for Biotechnology Information server and aligned by means of ClustalW. d Schematic drawing of truncated TOM70 used in domain mapping studies. e Streptavidin pull down assay was performed by biotinylated Orf9b or BSA incubated with truncated GST-TOM70-His in vitro. f Confocal microscopy of HEK 293T cells transfected by SARS-CoV or SARS-CoV-2 Orf9b-Flag, which were stained with an anti-flag antibody (green) and an anti-TOM70 antibody (red). The nuclei were stained using DAPI (blue). Scale bar, 10 µm. g. Confocal microscopy of HEK 293T cells transfected by SARS-CoV-2 Orf9b-Flag and HA-TOM70∆TM, which were stained with the anti-flag antibody (green) and an anti-HA antibody (magenta). The mitochondria were stained with MitoTracker® Orange CMTMRos (Red) and the nuclei were stained in blue using DAPI. Scale bar, 10 µm. h–j, IFN-β reporter gene assays using HEK 293T cells expressing Flag or Orf9b-Flag in the presence or absence of HA-TOM70 and induced by transfection of poly(I:C) (h, j) or MAVS overexpression (i). Luciferase activity is shown as fold induction. Data are representative of three replicates (mean and s.e.m. of n = 3 samples), *P < 0.05 and ***P < 0.01 (two-tailed unpaired t-test). E, HEK 293T cells expressing Flag only

