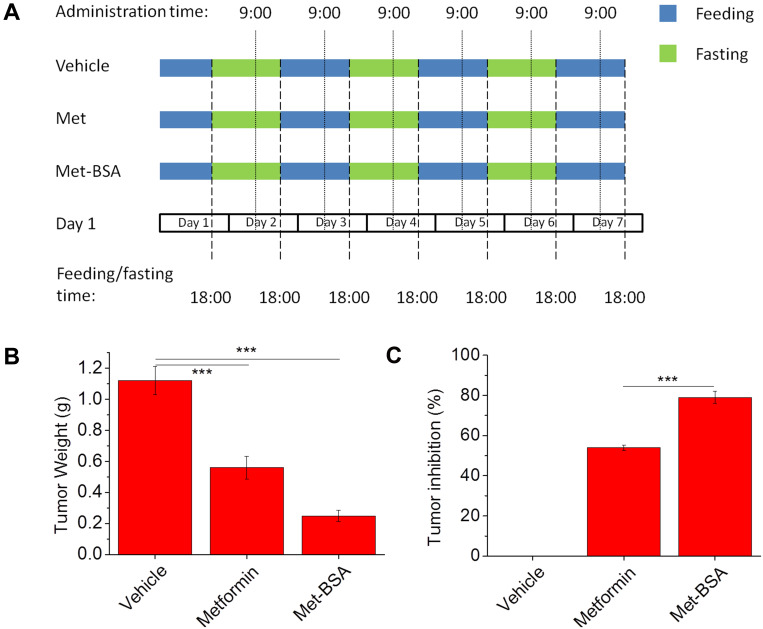
Figure 3.
(A) Schematic representation of the experimental design displaying the feeding protocols and timing of drug administration in different experimental groups. Effects of metformin and metformin-bovine serum albumin (met-BSA) on tumor (B) weight and (C) inhibition rate. Data were presented as mean ± standard deviation (n=6). ***Stands for p<0.005.

