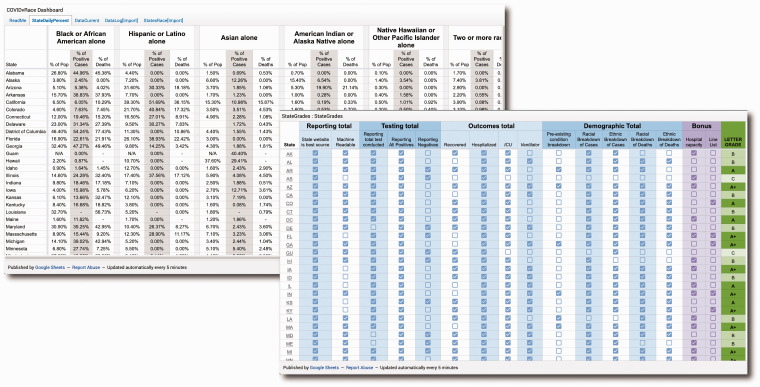
Figure 2.
The COVID Racial Data Tracker includes a dashboard showing daily case statistics by race for all states. Additionally, the project has created a table that shows the performance of all states across a variety of data reporting measures and assigns a grade to each state.
Source: reproduced with permission from The COVID Tracking Project (2020b).

