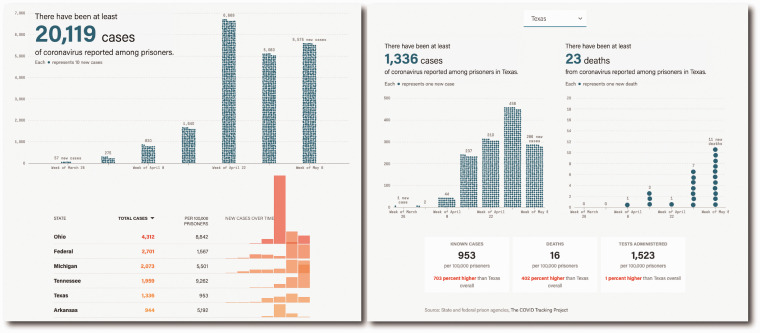
Figure 3.
These screenshots from “A State-by-State Look at Coronavirus in Prisons” show the visualizations used to track COVID-19 cases reported among prison populations in the United States, broken out over time and by state. Additionally, the project allows a reader to filter results to a single state and show counts of absolute number of cases and deaths, as well as a comparison of case and death rates to the entire state’s population.
Source: reproduced with permission from The Marshall Project (2020).

