
FIGURE 5.
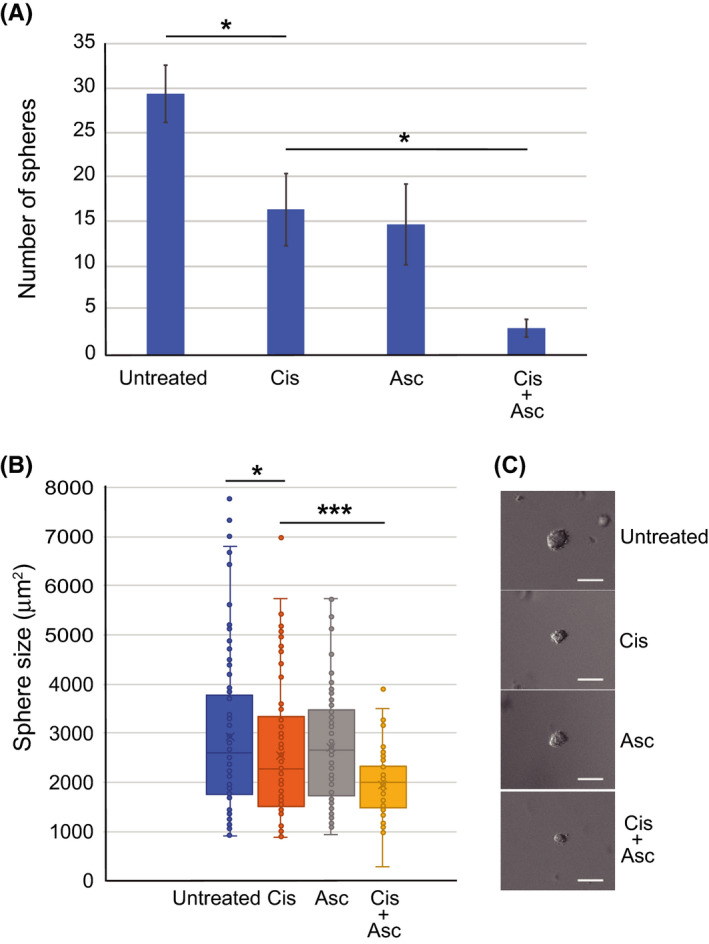
Cisplatin and ascorbate treatment reduced sphere formation. A, The difference in the number of spheres per microscopic field at 400× magnification. A representative result is shown (n = 15). B, The size distribution of spheres developed in cells treated with cisplatin, ascorbate, or cisplatin plus ascorbate (n = 70). C, Representative images of the spheres are shown (scale bar; 100 µm). The data represent the mean ± SD from three independent experiments. *P < .05; **P < .01; ***P < .001