
FIGURE 2.
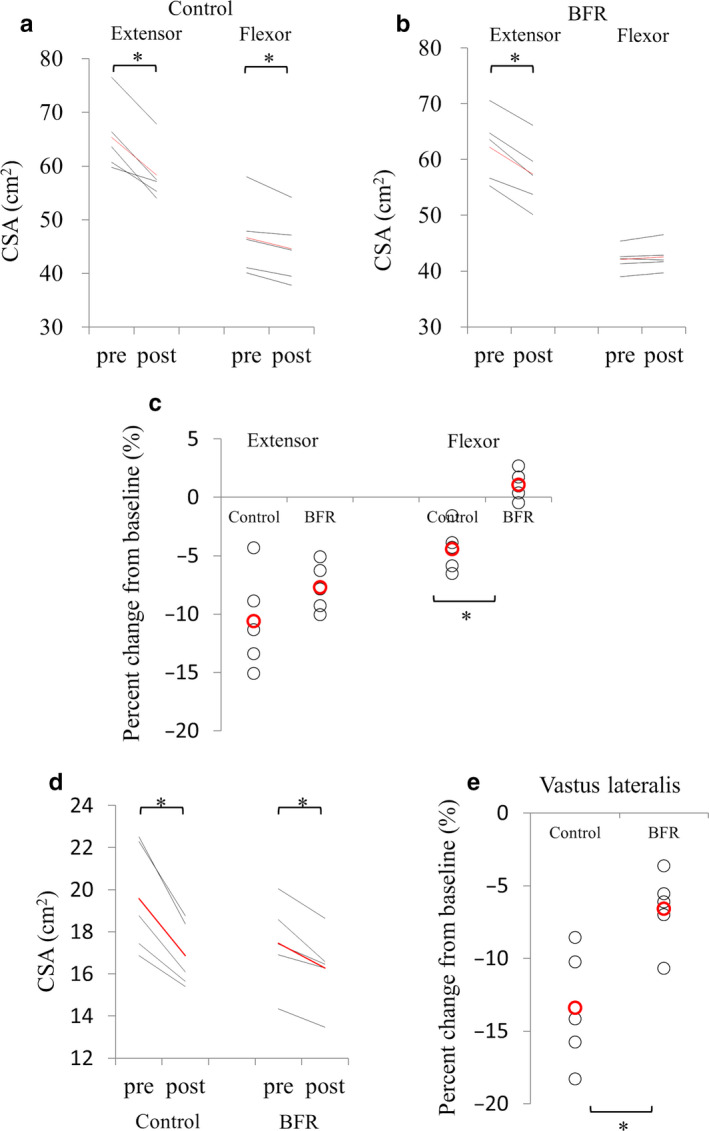
Changes in cross‐sectional area (CSA) of muscles in the control and blood flow restriction (BFR) groups. (a and b) Changes in CSA of thigh flexor and extensor muscles in the control group (a) and the BFR group (b). (c) Percent change in CSA in thigh flexor and extensor muscles. CSA compared with before CI is shown. (d and e) (e) Changes in CSA (d) and percent change (e) in the vastus lateralis muscle (a, b, d) Red line; average change. (c and e) Red circle; average change. *p < .05