FIGURE 2.

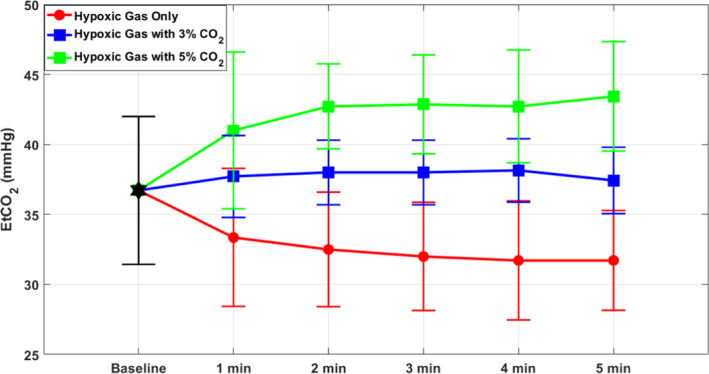
End‐tidal CO2 () measured at 1‐min intervals during gas exposure (means ± SD). correlates with concentration of CO2 in the inhaled gas mixture. Note that each group reaches steady state at 1 min

End‐tidal CO2 () measured at 1‐min intervals during gas exposure (means ± SD). correlates with concentration of CO2 in the inhaled gas mixture. Note that each group reaches steady state at 1 min