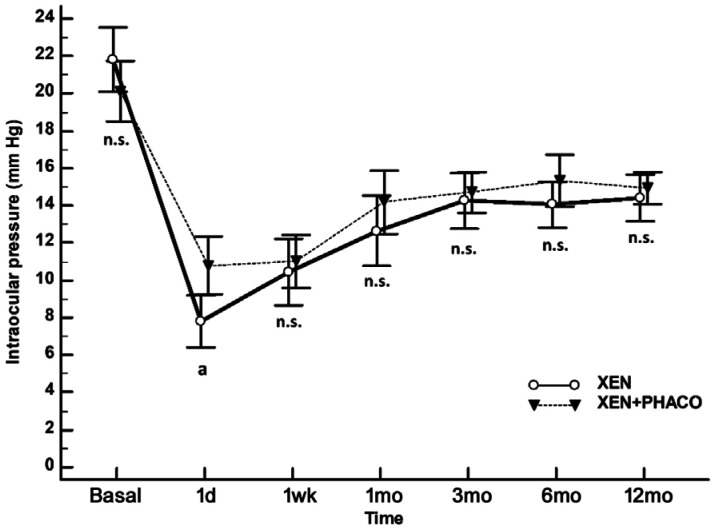
Figure 2. Unadjusted comparison of mean IOP between XEN implant alone and XEN+PHACO.
The vertical bars represent the 95% confidence interval. Statistical significance, at the different time point measurements, was determined using the one-way ANOVA test with the Scheffé's method. As compared to baseline, the mean IOP was significantly reduced, at every time point measured, P<0.001 (repeated measures ANOVA and the Greenhouse-Geisser correction).aP=0.004; n.s.: Not significant.

