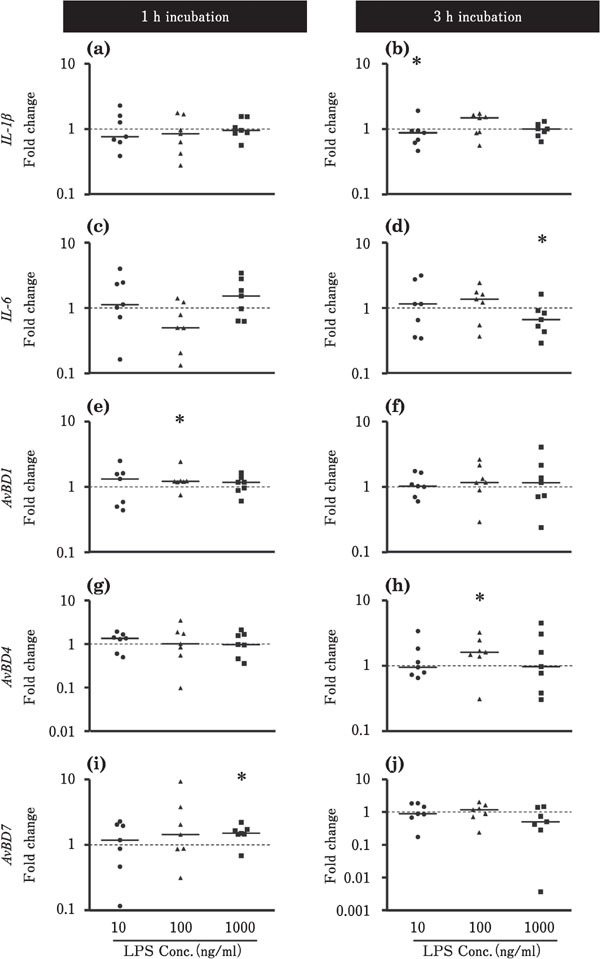
Fig. 5.

Changes in the expression of proinflammatory cytokines and AvBDs in the cultured chick cecum in response to LPS stimulation. Cecum tissues were cultured with 10 (●), 100 (▲), or 1000 (■) ng/ml LPS for 1 or 3h (n=7 for each condition). The values of the dots show the fold changes in gene expression in LPS-treated tissue relative to non-treated tissue (0 ng/ml LPS; value=1, dotted line). See Fig. 2 for the other experiment. *=Significantly different at P<0.05 between treated and non-treated groups.
