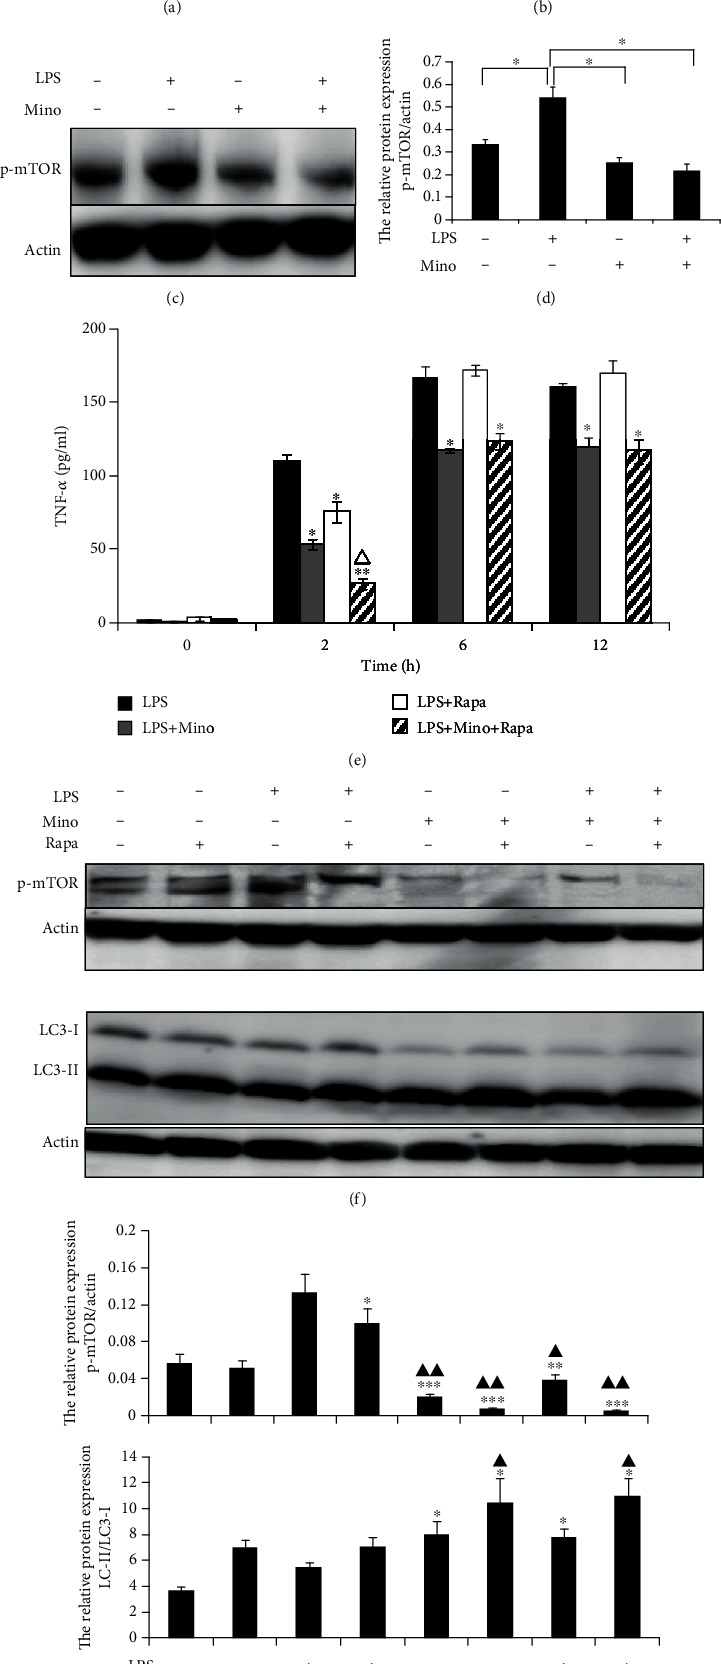
Figure 4.

Minocycline suppressed phosphorylated mTOR in LPS-stimulated THP-1 cells. Western blotting was performed to assess the level of phosphorylated mTOR. (a) THP-1 cells were stimulated with 1 μg/ml LPS for indicated time point. (b) Expression of p-mTOR relative to actin. (c) THP-1 cells were stimulated by 1 μg/ml LPS followed with 50 μg/ml minocycline for 12 h. (d) Expression of p-mTOR relative to actin. (e) The cooperative effect of rapamycin and minocycline to suppress TNF-α production in LPS-stimulated THP-1 cells. THP-1 cells were preincubated with 5 μm rapamycin for 1 h followed by 1 μg/ml LPS without or with 50 μg/ml minocycline for 12 h. The concentration of TNF-α in the supernatants was measured by ELISA. Data represented as the means ± S.D. (N = 3, ∗p < 0.05, ∗∗p < 0.01 vs. LPS, △p < 0.05 vs. LPS+Rapa). (f) The cooperative effect of rapamycin and minocycline to suppress phosphorylated mTOR and induce autophagy. Western blotting analysis of p-mTOR and LC3 in cell lysate from different treatment groups. (g) Expression of p-mTOR relative to actin and the ratios of LC3-II to LC3-I. Data were represented as the means ± S.D. (N = 4, ∗p < 0.05, ∗∗p < 0.01, ∗∗∗p < 0.001 vs. LPS, ▲p < 0.05, ▲▲p < 0.01 vs. LPS+Rapa). Mino: minocycline; Rapa: rapamycin.
