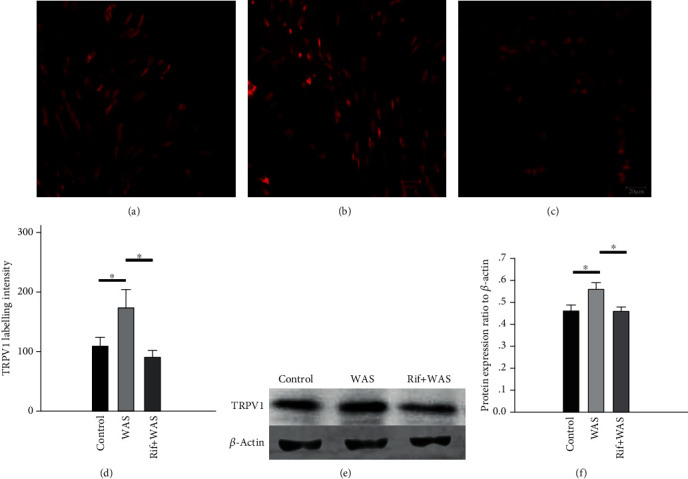
Figure 2.

The immunoreactivity (IR) and protein expression level of TRPV1 in L6S1 dorsal root ganglions (DRGs) and in L6S1 segments of the spinal cord of rats. Representative immunofluorescence images of TRPV1 IR-positive neurons in L6S1 DRGs from the control group (a), WAS group (b), and Rif+WAS group (c). Quantification of TRPV1 IR labelling intensity (d). Representative western blot for TRPV1 in extracts from the L6S1 segment of the spinal cord (e). Relative quantification for western blot analysis (f). Data are expressed as density normalized to β-actin (mean ± SEM, n = 6, ∗P < 0.05).
