
Figure 2.
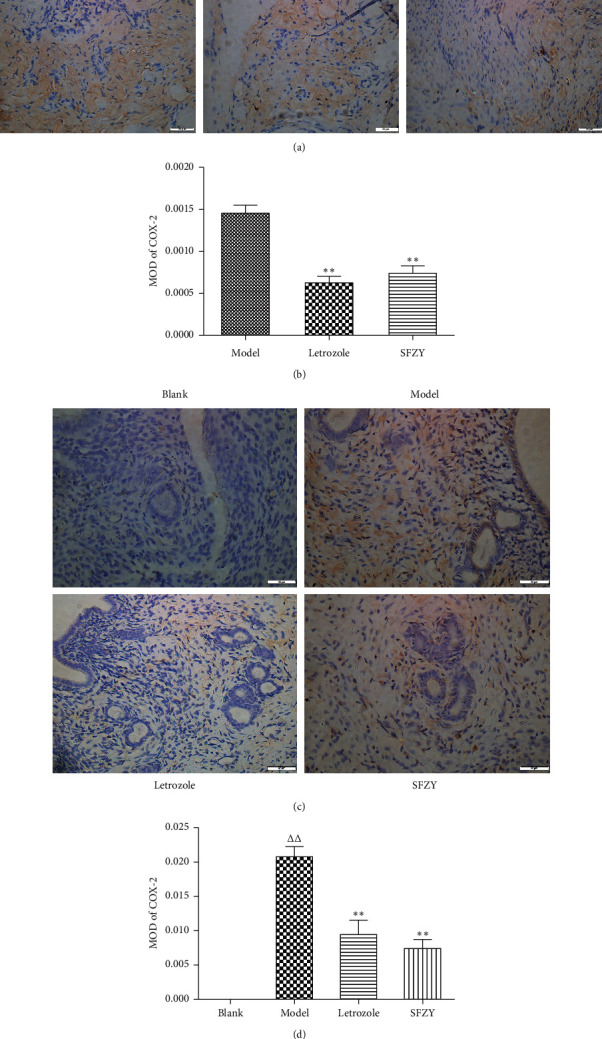
Representative images of immunohistochemical staining of COX-2 in endometriotic lesions and normal endometrium. (a) Sections stained for COX-2 in endometriotic lesions (magnification, ×400). (b) Mean optical density (MOD) values of the COX-2 expression (n = 6); one-way ANOVA with Tukey's test, ∗∗P < 0.01 compared with the model group. (c) Sections stained for COX-2 in the endometrium (magnification, ×400). (d) Mean optical density (MOD) values of the COX-2 expression (n = 6); one-way ANOVA with Tukey's test, ΔΔP < 0.01 compared with the blank group and ∗∗P < 0.01 compared with the model group.