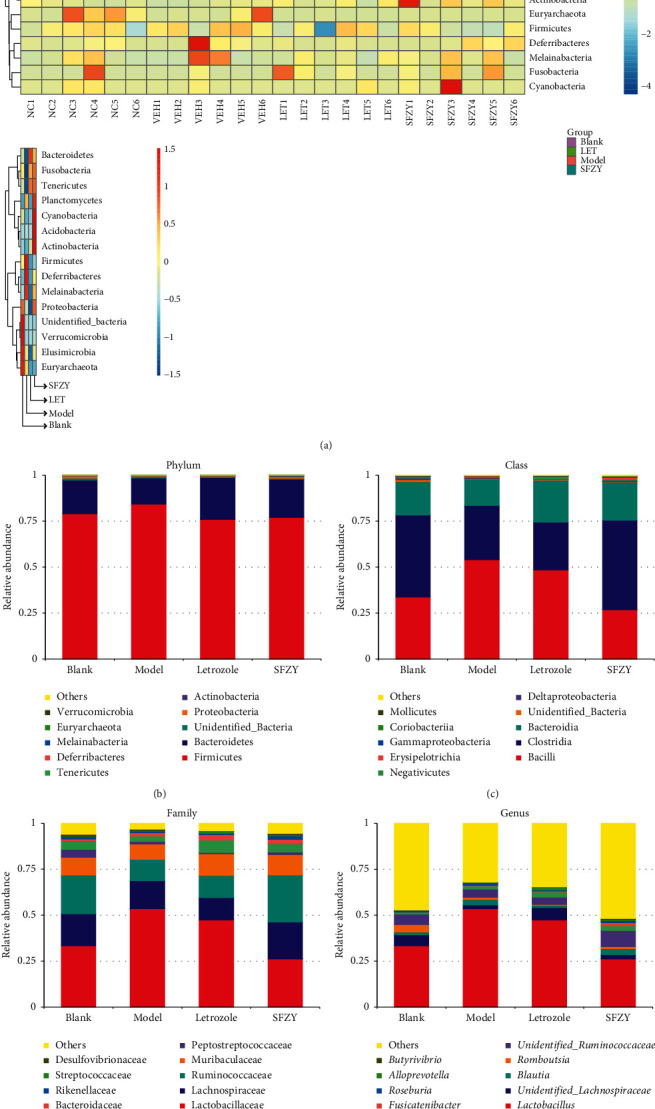
Figure 4.

Analysis of species composition of gut microbiota among groups using OUT analysis (n = 6). (a) Heatmap representation of relative abundances of the phyla in fecal samples from each group. Microbiota distribution at the phylum level (b), class level (c), family level (d), and genus level (e).
