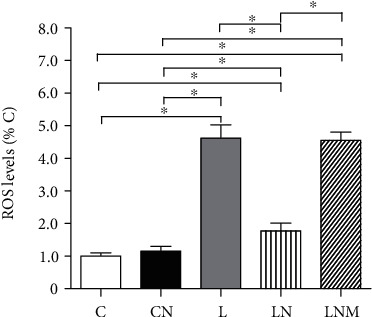
Figure 10.

ROS levels in the L6 skeletal muscle cells of different groups (presented as percentages of the C group). Data are presented as the mean ± SD. ∗P < 0.01. C: control group; CN: PBS+NRG group; L: LPS group; LN: LPS+NRG group; LNM: LPS+NRG+MK-2206 group.
