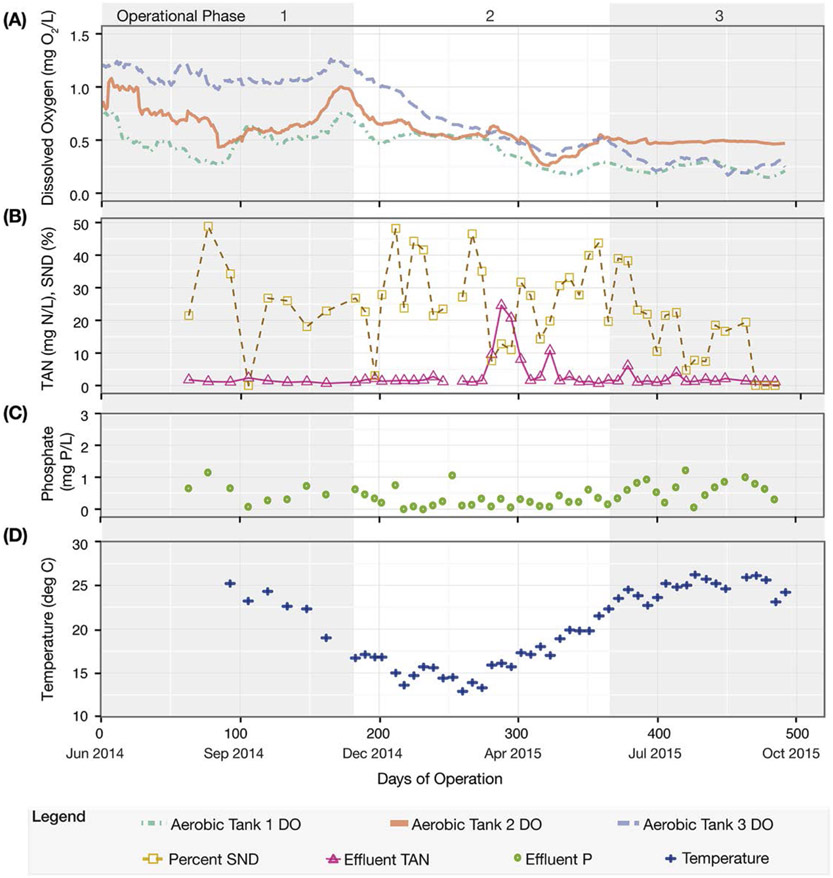
Figure 2.
Pilot plant performance during the three operational phases. (A) Dissolved oxygen (DO), represented as a 20-point moving average time series from the three aerobic tanks. (B) Effluent Total Ammoniacal Nitrogen (TAN) and percent of simultaneous nitrification and denitrification (SND). (C) Effluent phosphate (P). (D) Activated sludge temperature.

