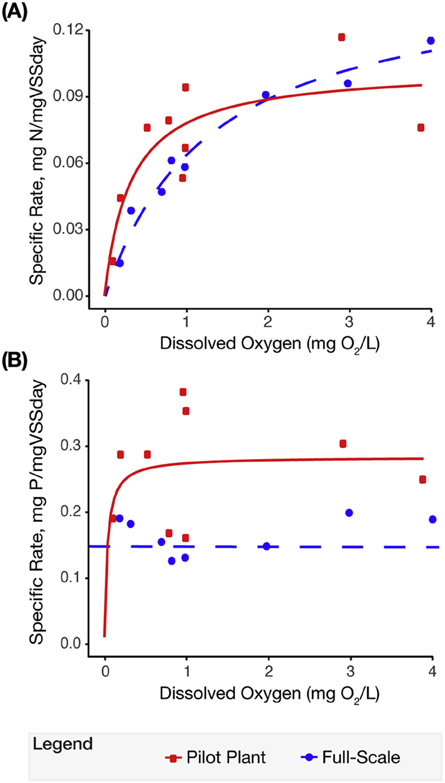
Figure 4.
Comparison of specific rate of ammonia oxidation of activated sludge from the full-scale plant, and from the pilot-scale plant, after stable low-DO operation. Points represent experimental measurements of specific rates at different DO concentrations. Lines represent the best-fit of a Monod kinetic model to the experimental data. (B) Specific rates of phosphorus uptake of activated sludge from the full-scale plant and from the pilot-scale plant after stable low-DO operation (phase 3). Symbols represent experimental measurements of specific rates at different DO concentrations. A Monod kinetic model (solid line) could only be fitted to the data from the pilot-scale plant. A dashed line represents the average maximum specific rate for the full-scale plant.

