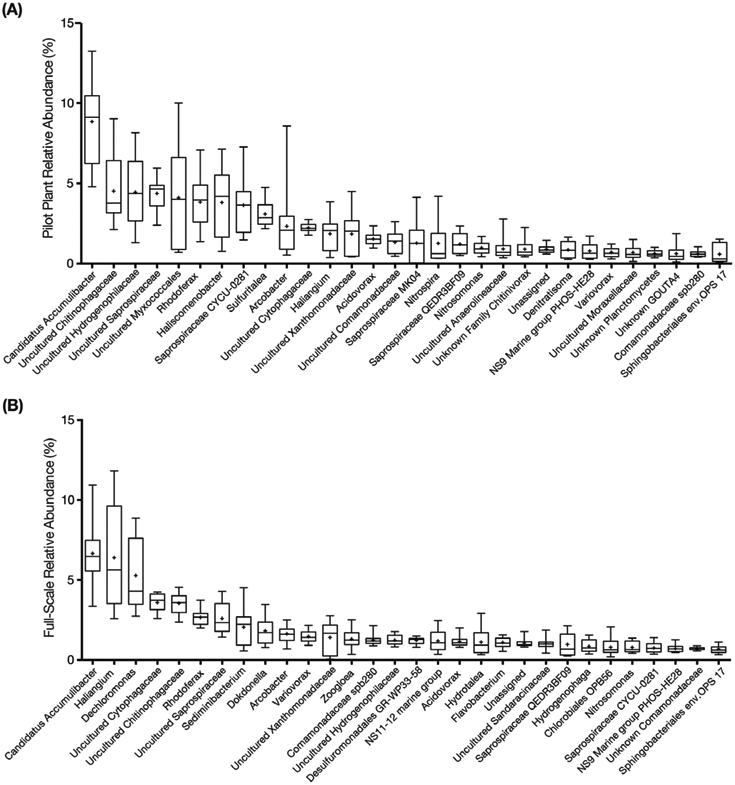
Figure 6.

Box plots of the 30 most abundant core taxa classified at the genus level (by median) for (A) Pilot plant, and (B) Full-scale plant during the low-DO operational phase (phase 3). The names in the horizontal axis are the lowest assigned taxonomic rank. The upper and lower bounds of the boxes represent the 25th and 75th percentiles, the whiskers denote the maximum and minimum values, and the plus symbol represents the mean.
