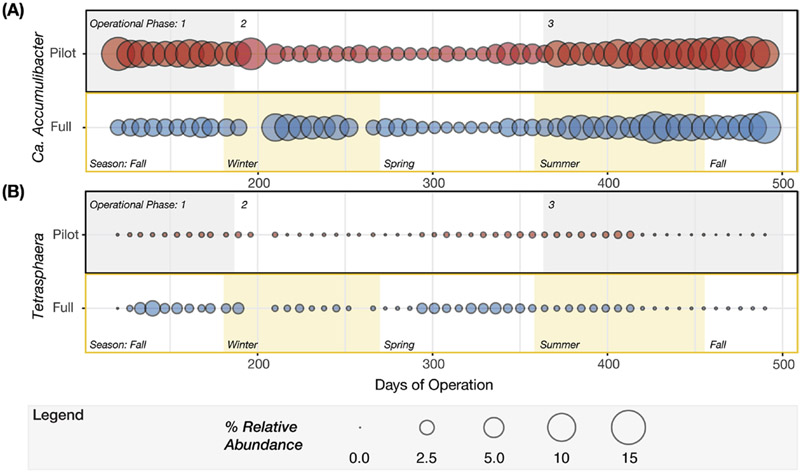
Figure 7.
Balloon plots representing temporal variation in relative abundance of genera known to perform phosphorus cycling in EBPR reactors, (A) Candidatus Accumulibacter and (B) Tetrasphaera. For each genus, the pilot plant is described in the upper panel and full-scale plant in the lower panel. Relative abundance was determined based on the entire community. The shaded areas in the upper panels denote the three operational phases, whereas the shaded areas in the lower panels indicate the meteorological seasons between days 120 and 490 of pilot plant operation.

